 Contact Us
 Contact Us
- SAISON TECHNOLOGY
- Investor Relations
- Financial Highlights
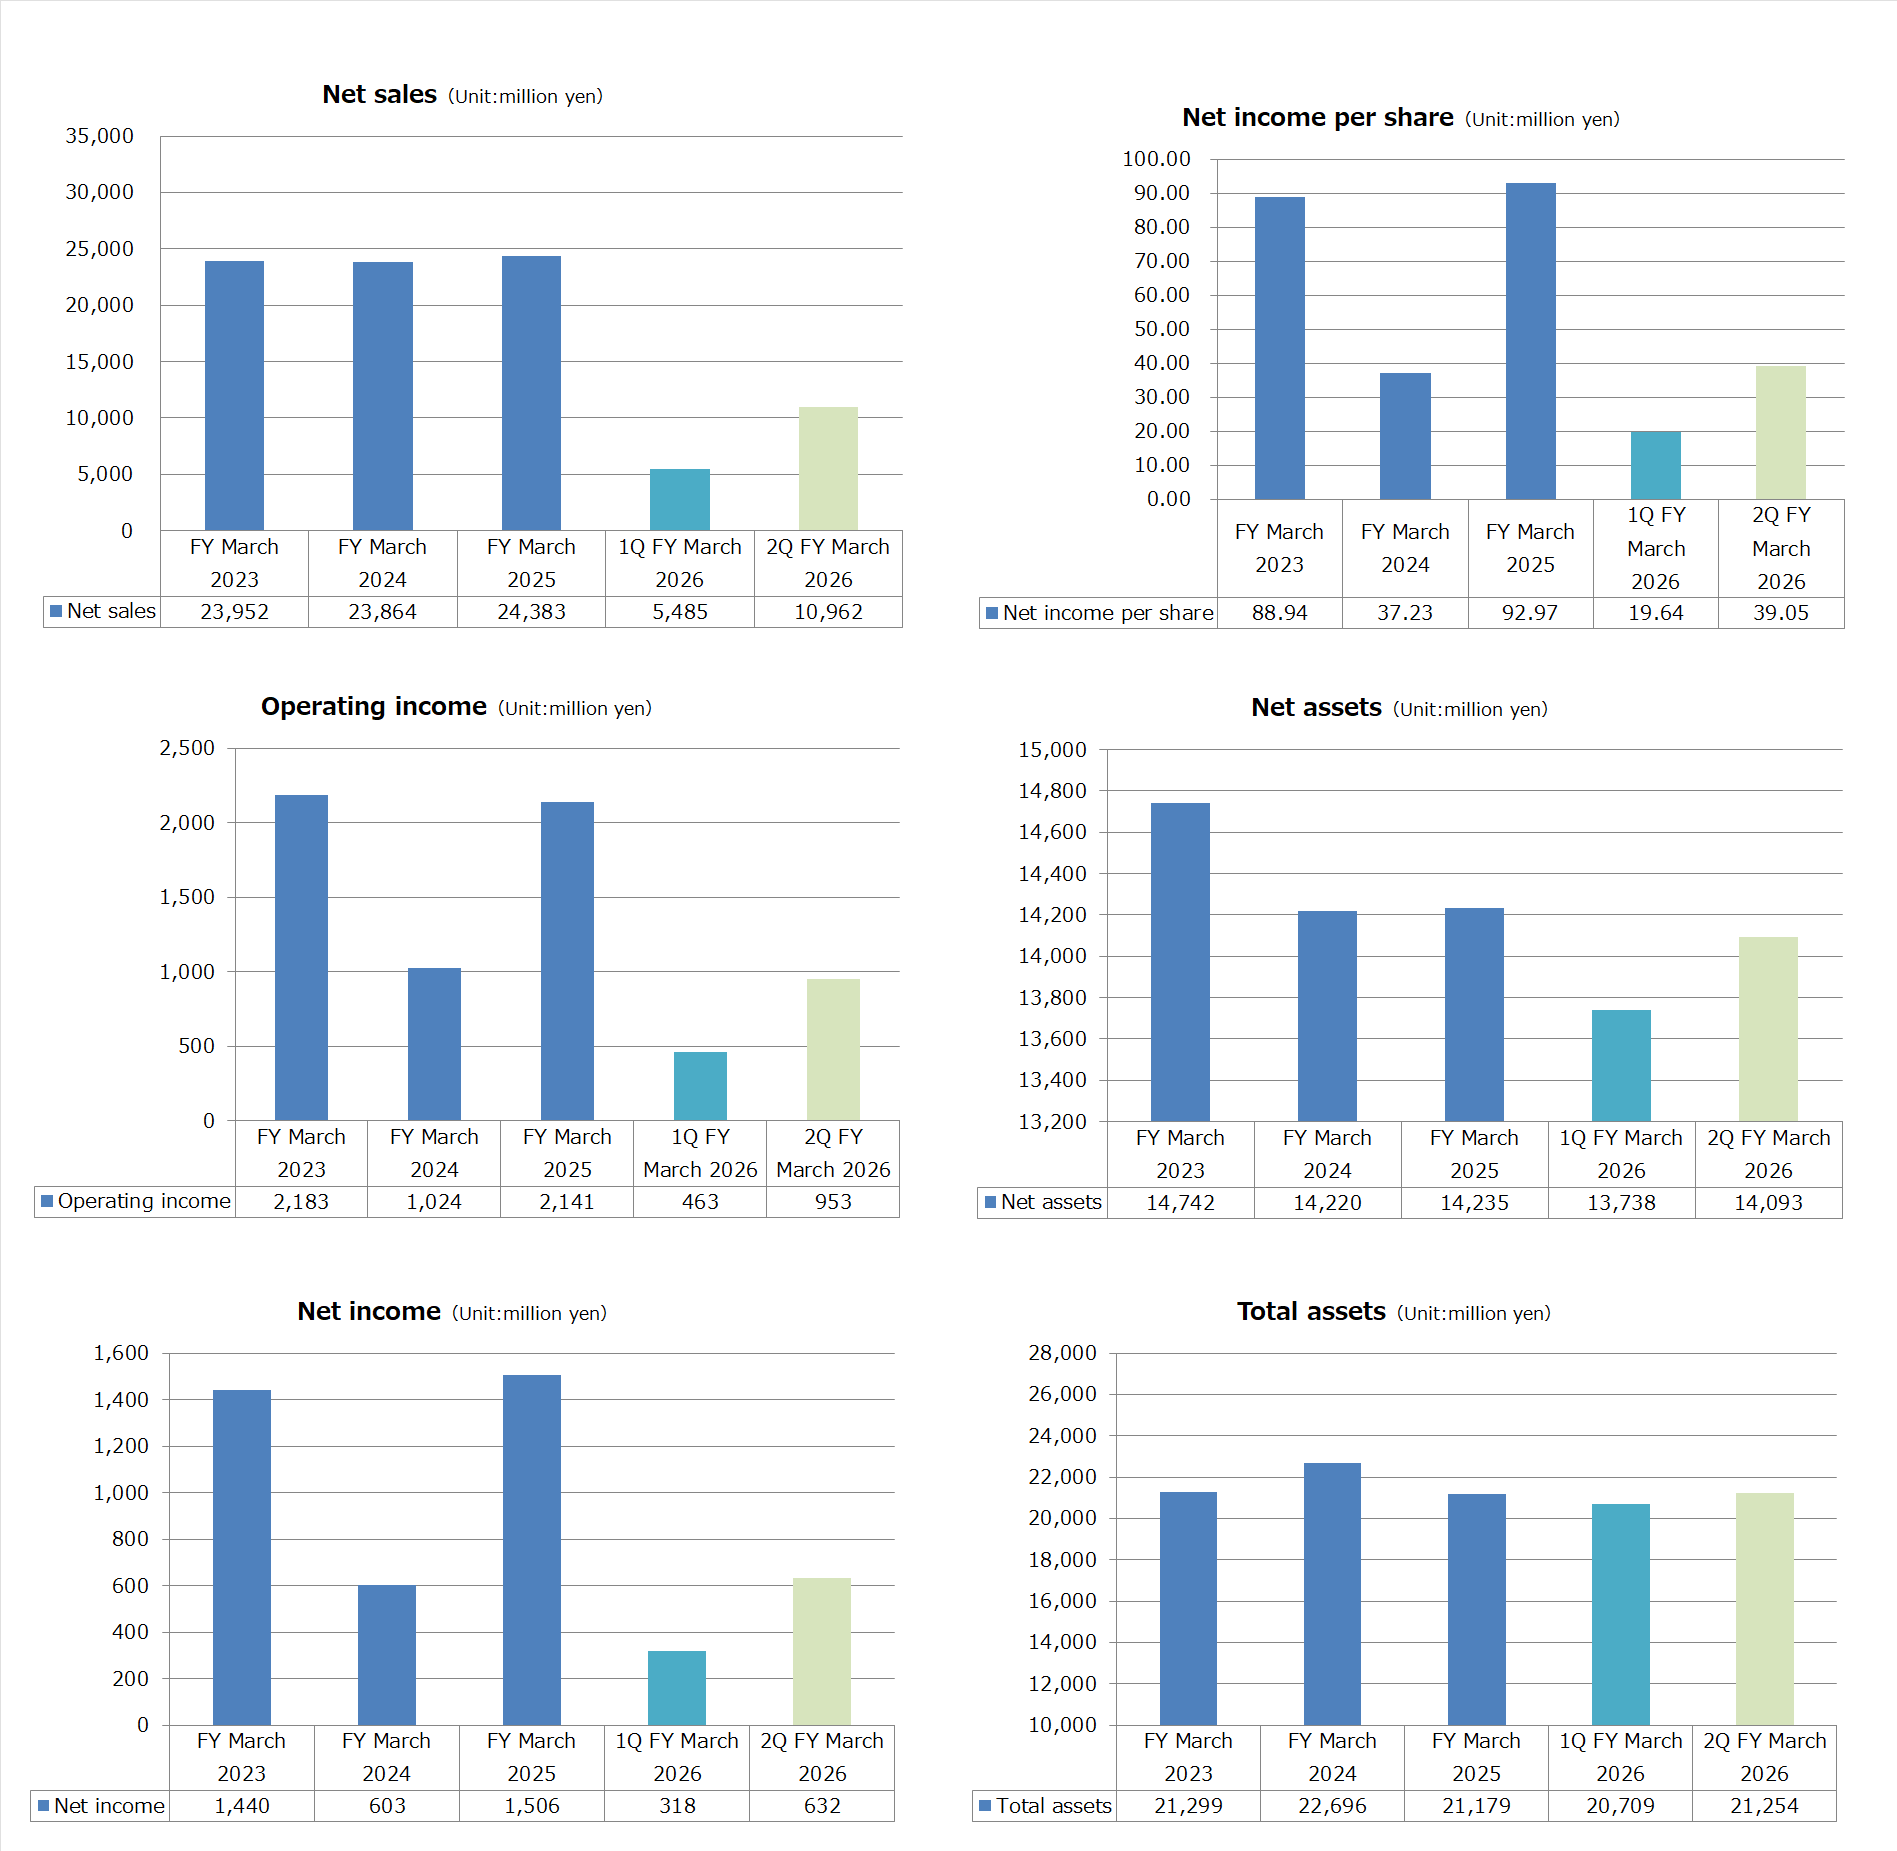
Financial Highlights
Financial Statements
Financial Results Briefing
※Our Financial Results Briefing is conducted in Japanese. This video provides reference material using AI translation. In the event of any discrepancies in meaning, the original Japanese version will take precedence.
Financial Highlights
Reporting segment

(Unit:million yen)
| FY March | FY March 2021 | FY March 2022 | FY March 2023 | FY March 2024 | FY March 2025 |
|---|---|---|---|---|---|
| HULFT Business | 8,398 | 8,775 | 9,314 | 9,951 | 9,998 |
| Data Platform Business | 1,371 | 1,953 | 2,115 | 2,481 | 2,828 |
| Retail IT Service Business |
3,212 | 3,059 | 3,086 | 2,812 | 3,730 |
| Financial IT Service Business |
9,553 | 9,490 | 9,482 | 8,618 | 7,825 |
| Total | 22,499 | 23,218 | 23,952 | 23,864 | 24,383 |
*On April 1,2020, the Fintech Platform Business has been renamed to the Financial IT Service Business.
*On April 1,2020, the Linkage Business has been spun off from the Retail IT Service Business.Net sales for the Retail IT Service Business for the fiscal year ending March 2020 was calculated based on retroactively adjusted figures.
*On April 1,2022, the Linkage Business has been renamed to the Data Platform Business.