"Demand forecasting" is one of the AI utilization patterns that is simple to build and has a noticeable effect ~ Building a call volume forecasting AI pattern ~
AI has been rapidly gaining attention in recent years, and the financial industry has been quick to adopt it due to the nature of the industry and business. Finance requires high security as well as real-time performance, and banks have a large number of branches and staff, so it was hoped that the use of AI would lead to improved operational efficiency and labor savings.
However, there are many obstacles to overcome when introducing new technologies and concepts. This time, we asked Soichiro Hashizume, who is in charge of big data in the President's Office at SBI Holdings, Inc. and wrote the fourth chapter of the book "Patterns for Successful Financial AI," published in February 2023, to explain the creation of "demand forecasting patterns," one way in which AI is being used in the financial industry.
▼Profile
Financial Data Utilization Promotion Association, Planning and Publication Committee
SBI Holdings, Inc. President's Office, Big Data
Mr. Soichiro Hashizume
*Titles and affiliations are those at the time of interview.
Immediately after joining SBI Holdings, I was assigned to the demand forecasting team.
First, could you introduce yourself?
I am in charge of big data in the President's Office at SBI Holdings, the same position as Nabekura (see "Financial AI Success Patterns" Chapter 2: Targeting AI Pattern Commentary Article), and I am leading the use of big data within the group. I joined the SBI Group three years ago, and in my first year there I was part of the call volume forecasting project team at SBI Insurance.
Call volume forecasting is the process of predicting the volume of calls coming into a call center. It predicts the number of customers who call the call center and connect with an operator by hour, day of the week, season, etc. This helps determine the appropriate number and allocation of operators.
In addition to these big data and AI projects and the launch of the AWS analysis platform, he is also responsible for educational activities such as building a CoE (Center of Excellence, a cross-departmental organization) and training citizen data scientists.
This time, we will explain AI that predicts demand, such as the "call volume prediction" mentioned earlier.
What does the financial industry expect from demand forecasting?

What effects are expected from demand forecasting AI in the financial industry?
Financial institutions are characterized by having call centers and many branches. This means they are required to optimize their personnel and resources to match demand. This demand forecasting often relies on the experience and intuition of the person in charge, and if it is done subjectively, it can be difficult to make detailed forecasts. This is why demand forecasting is done using AI.
Experience and intuition vary from person to person, but we believe that AI can more accurately predict demand and make it possible to optimally allocate personnel and resources without relying on experience and intuition.
Are there any specific examples of demand forecasting using AI?
This time we will introduce call center demand forecasting and ATM demand forecasting.
First, let's talk about demand forecasting for call centers. As mentioned above, call centers are constantly tasked with staffing, which means creating shifts. As a simple example, let's say you have 10 people assigned during the day and the same 10 people assigned at night. Common sense tells us that the number of calls will be lower at night than during the day, so this would be an inappropriate shift.
When a new financial service is announced, or when a partnership or merger is announced, more staff than usual are required. In addition to these changes in time and news, there are also changes depending on the season and day of the week. AI can be used to analyze the same conditions in the past and find the appropriate shifts.
Does this mean that it will lead to a reduction in labor costs?
We believe that this can be used not only to create appropriate shifts, but also for recruitment activities. When a new financial service is announced, it is necessary to increase the number of operators in the short term, but if it is clear that the number of customers will increase in line with the growth of the company or business, it will be necessary to increase the number of operators in the long term, in other words, to make a recruitment plan. In such cases, it can be used to determine, for example, "how many people should we hire?"
The reason we used call centers as an example is that demand forecasting can be used in a wide range of applications, and the data preparation required to get started is very simple, making it easy to get started.
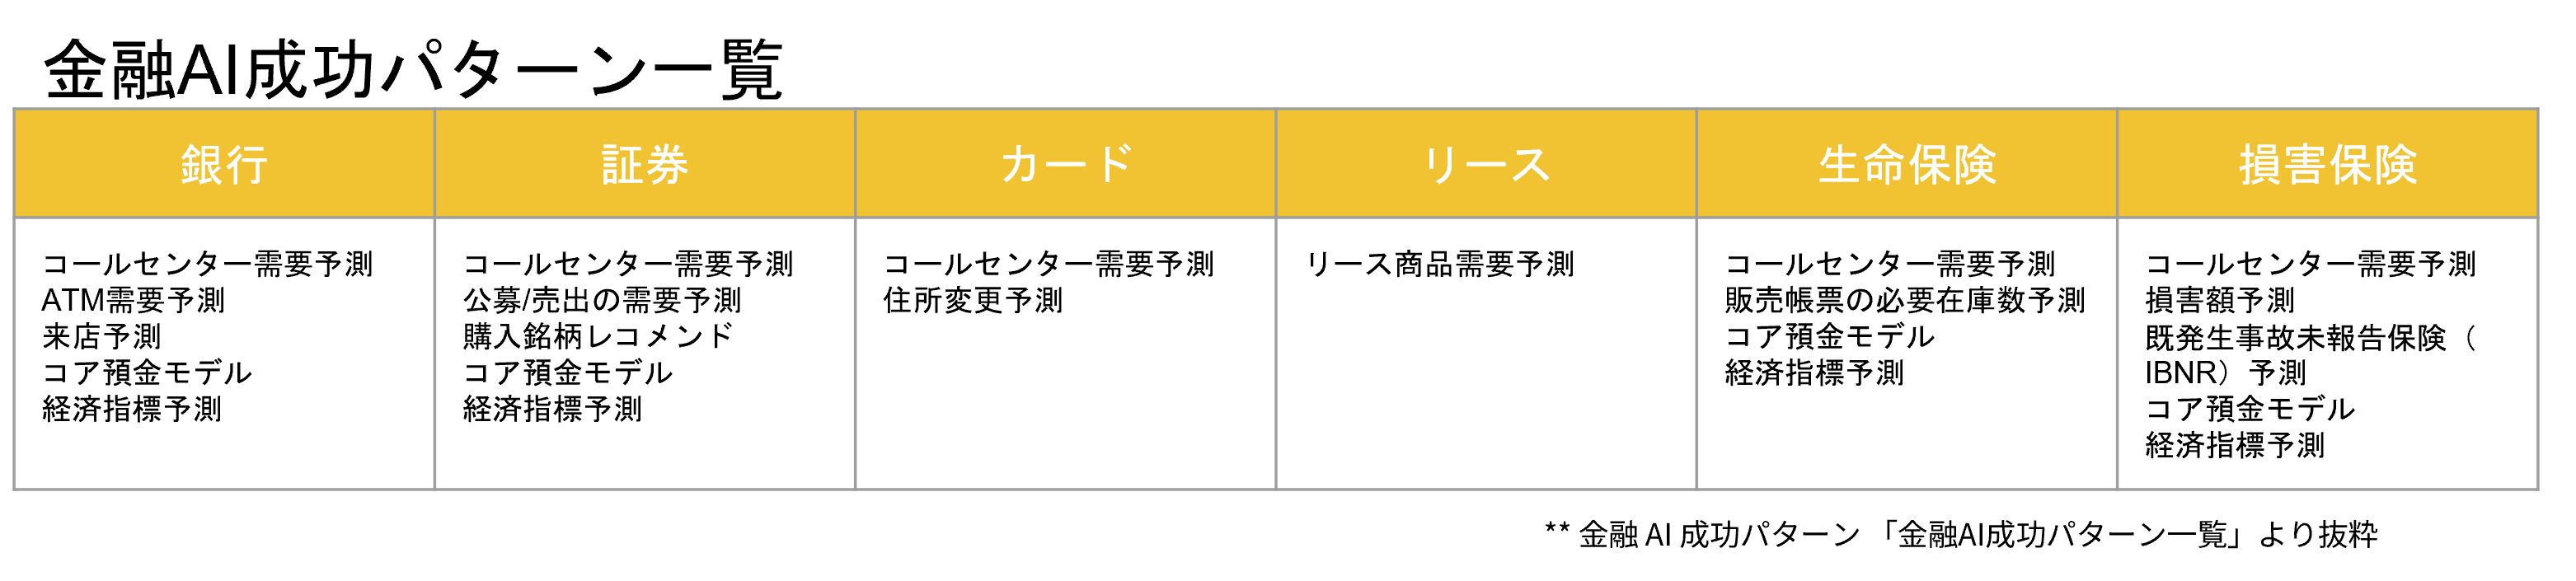
Excerpted from "Success Patterns for Financial AI." Examples of AI use and demand forecasting in the financial industry.
*An explanatory video is provided at the end of the article.
Data prepared when building demand forecasting AI patterns
Can you talk specifically about building AI demand forecasting for call centers?
Call center demand forecasting means predicting "call volume." Call volume refers to the number of calls per unit time coming into a call center. "Traffic volume forecasting" means learning past call volume trends and predicting future call volume.
Let's take a look at this in detail.
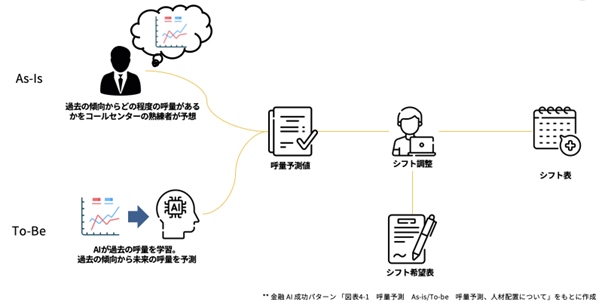
When you want to use it to adjust operator shifts
*An explanatory video is provided at the end of the article.
As-Is is the current state where call volume is predicted by an expert using experience and intuition. To-Be is the state we aim for where AI is predicting call volume. The process after that is actually the same. The only difference is whether the data to be used as the basis for shift creation and recruitment activities is "human" or "AI." Simply put, this is a project to "replace with AI."
Can you tell us about the data source?
When talking about this, we first need to consider "what kind of data can be obtained?" In the case of a call center, data can be obtained about which lines calls are made from and for what purpose. We will explain the specific data that can be obtained.

Call centers and the data they generate
*An explanatory video is provided at the end of the article.
When a customer calls, an ID is assigned to identify them. If the same customer calls with a different inquiry, a different ID is naturally assigned. Then there's the contact point that made the call, the date of the call, whether the call was connected or not, the start time of the call, the duration of the call, and any notes entered by the operator.
This is the main data that is recorded at call centers. There are also voice recordings and other data.
Can a demand forecasting AI be built using only that data?
Of course, this is not all. Calendar data, in other words, basic data such as holidays, is also necessary. If we only use the above, there is a risk that in months with long holidays such as Golden Week, we may make the wrong decision to reduce staff because there is little call volume. Of course, this will not happen, but it is important to include factors that allow the AI to make appropriate decisions.
In addition to the above, it is also a good idea to prepare data that may be factors that lead to calls to the call center, such as data obtained from marketing activities, the number of subscribers, or the number of active users if it is an application inquiry desk. Data that is a factor in calls to the call center = data that will improve the accuracy of call volume forecasts.
Processing the data source for modeling
Once the data is ready, what are the next steps?
I think of it in four steps:
1: Deciding how to build the model
2: Creating target data
3: Creating feature data
4: Modeling
First, you need to decide how to build the model. In other words, you need to decide the unit of prediction, or more specifically, "when, what, and how much" to predict. In the case of traffic volume prediction, setting the prediction period is especially important.
This time, we will set the traffic volume prediction results to be "output between the 20th and 25th of each month." The desired predicted data is "traffic volume occurring in the month after next." The prediction range is "one month," and the predicted amount is "traffic volume per day." The prediction type is "total traffic volume."
Next, select the features, that is, the period for obtaining the forecast data. In this example, we will use data on the traffic volume up to the previous day, and dates such as the day of the week, Saturday, Sunday, public holiday, consecutive weekend, three-day weekend, the beginning of the month, and the end of the month as features.
Can you tell me about creating targets?
I mentioned earlier that "preparing the data to get started is very simple," but creating the data is easy when it comes to call volume forecasting. We decided to forecast volume "per day," so we specify the date and time in yyyymmmmdddd format. If you also want to know the time period, you can specify the time in hh:00:00 format. Then, we'll tally up the number of calls per unit time as call volume.
As you can see, the data source for traffic forecasting is very simple.
▶ "Financial AI Success Patterns" Chapter 2: Targeting AI Pattern Commentary
How did you create a learning model and set the features?
Now that we have the data sources, can you tell us about the AI learning model?
We will now create a feature for the call volume mentioned earlier. There are many ways to create a feature, but this time we will only introduce a lag variable.
A lag variable is one of the features used to predict the objective variable, and it refers to past data on traffic volume, which is the objective variable. For example, if traffic volume three days ago was 100, and two days ago it was 30. If it rose to 90 again one day ago, we can predict that it will drop again on the day that corresponds to "today." This can also be thought of in terms of weekly, monthly, etc., rather than daily. As mentioned earlier, months with long holidays are likely to have lower traffic volume than other months, but if similar results have been seen in past trends, the AI can predict that traffic volume will (probably) be lower in May.
Please see the figure below.
If the number of incoming calls on Saturday, July 2, 2022, was 1,166, the AI could predict that the numbers for the following Sunday and the following Saturday would be around the same. Furthermore, by learning the difference between Friday and Saturday, when weekdays become holidays, and the same day the previous week, the AI can potentially reduce errors.
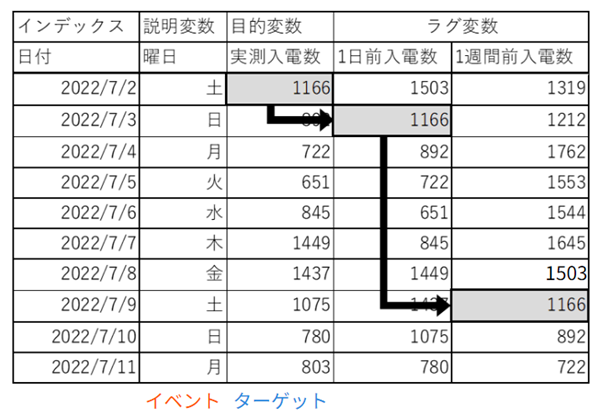
Creating feature data Lag variables
*An explanatory video is provided at the end of the article.
Can you tell us about the modeling?
This time, we will build AI using AutoML (Automated Machine Learning), just like Nabekura (article explaining the targeting AI pattern in Chapter 2 of "Patterns for Successful Financial AI"). AutoML is a technology that automates the data science process when performing analysis using AI, such as creating lag variables and trying out the many modeling methods that exist. We will input the data sources that we have set up and created so far into AutoML and perform modeling.
AutoML actually tests many of these AI models and selects the AI model that it determines to have the highest accuracy. For time series problems, it automatically selects features and lag variables that affect the target.
Demand forecasting makes it easy to see the impact and effects
Finally, can you tell us about verification?
Nabekura (article explaining targeting AI patterns in Chapter 2 of "Patterns for Successful Financial AI") also explained that there are two types of AI accuracy verification: practical verification, which involves actually implementing measures, and desk-top verification, which involves verifying using past data.
For this demand forecast, the model is created monthly. For example, the model is created between the 20th and 25th of May, and the forecast for July, two months later, is output. When forecasting in May, the May model is used, and when forecasting in June, the June model is used.
When selecting a model, cross-validation is performed to create a forecast model for May, checking the accuracy of several algorithms in April, March, and February, the months immediately preceding May, and then adopting the algorithm with the best accuracy.The actual forecasts are then trained using data up to May.Then, in practical testing using the forecast model, we will check the KPI that is actually applied and used in practice, in this case abandoned call volume.
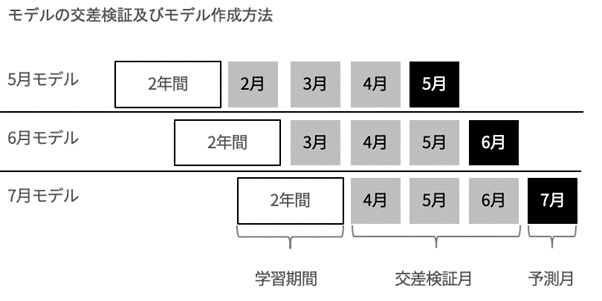
Desk verification
*An explanatory video is provided at the end of the article.
This time, we have explained demand forecasting using the example of "call volume forecasting." Call volume forecasting is expected to lead to "staff allocation that eliminates personal dependency" and "reduction of abandoned calls (i.e. calls that are hung up before the call is connected) through shift optimization." This also has many business impacts, such as reducing man-hours through task automation and accumulating knowledge.
I didn't explain how to monitor and scrutinize learning models, but AI accuracy can decline over time. Regular monitoring of data and prediction accuracy is necessary. Let's utilize and incorporate AI, but building and running it isn't the goal. It only starts once the AI is functioning properly, so I hope you'll find your own goals from many ideas and realizations. I'd also be happy if you could share your realizations and concerns.
Written by Financial Data Utilization Promotion Association
"Success Patterns for Financial AI"
Now on sale and a big hit!
"FDUA Financial Data Utilization Promotion Association Tie-up Project" video
On Saison Technology's official YouTube channel,
We would like to introduce an explanatory video by Soichiro Hashizume of SBI Holdings, Inc., who was in charge of writing Chapter 4.
Please see also.
Related Content
-

Survival Strategy in an AI-driven Society: How will humans live in an artificial super-intelligence society?
-

Applicable AI that can quantitatively judge and evaluate core credit operations of banks - Tips for developing credit screening AI -
-

Grasp insights that cannot be grasped through numbers from text and qualitative information! ~ Characteristics of text classification AI ~