Sustainability Data
You can view data on Saison Technology's sustainability initiatives.
society
Diversity
| item | unit | 2020 | 2021 | 2022 | 2023 | FY2024 | |
|---|---|---|---|---|---|---|---|
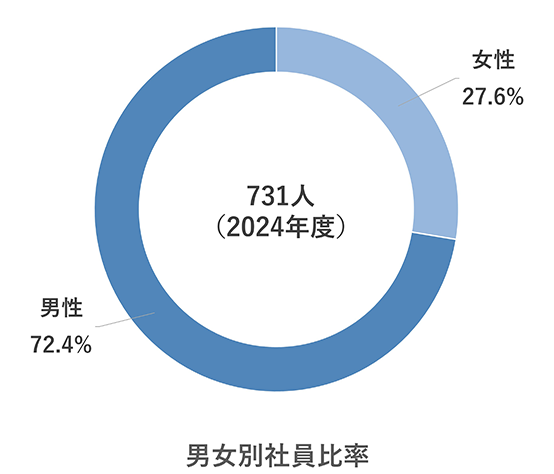
| Number of employees | male | people | 493 | 471 | 492 | 523 | 529 |
| woman | people | 168 | 170 | 176 | 191 | 202 | |
| total | people | 661 | 641 | 668 | 714 | 731 | |
| Female employee ratio | % | 25.4 | 26.5 | 26.3 | 26.8 | 27.6 | |
| Executive Officers (female) * | people | 4(0) | 11(0) | 11(0) | 5(0) | 5(0) | |
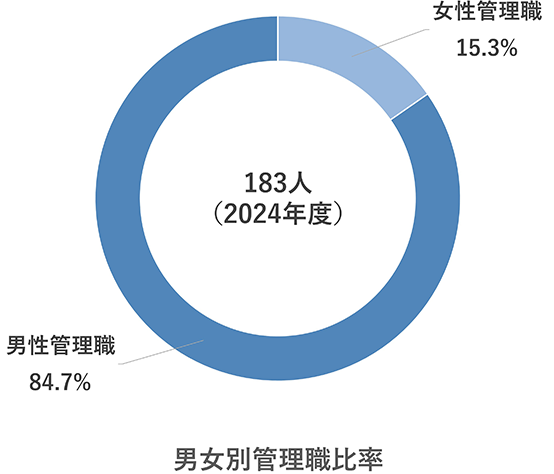
| Number of managers (female) | Manager position * | people | 31(1) | 25(2) | 40(3) | 53(5) | 44(5) |
| Section manager position * | people | 69(10) | 63(7) | 67(9) | 67(13) | 74(15) | |
| Ratio of female managers * | % | 10.6 | 9.1 | 10.2 | 12.8 | 15.3 | |
| Number of new hires: New graduates (female) | people | 21(7) | 20(5) | 20(7) | 18(6) | 22(9) | |
| Number of new hires: Mid-career (female) | people | 26(6) | 31(8) | 42(10) | 70(22) | 40(12) | |
| Female new hire ratio: New graduates and mid-career | % | 27.7 | 25.5 | 27.4 | 31.8 | 34.9 | |
| Number of foreign employees | people | 12 | 12 | 9 | 12 | 11 | |
| Employment rate of people with disabilities | % | 2.1 | 2.0 | 2.2 | 2.1 | 1.9 | |
| Average age | age | 42.1 | 43.0 | 43.1 | 43.0 | 42.9 | |
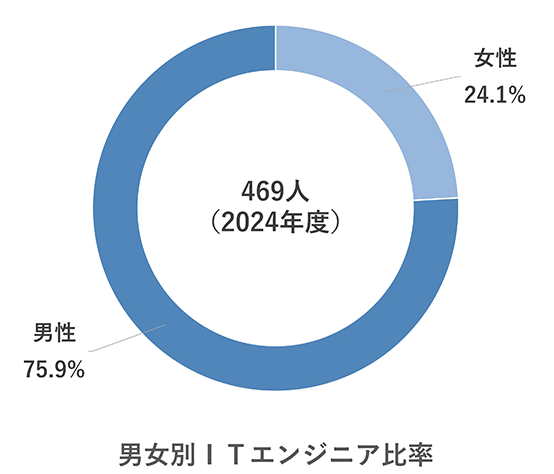
| IT engineer (female) | people | - | - | 417(100) | 448(108) | 469(113) | |
| Ratio of female IT engineers | % | - | - | 24.0 | 24.1 | 24.1 | |
- From fiscal year 2023 onwards, the aggregated figures as of the beginning of the following fiscal year will be listed (for fiscal year 2022 and earlier, the aggregated figures as of the end of the fiscal year will be listed).
| item | unit | 2020 | 2021 | 2022 | 2023 | FY2024 | |
|---|---|---|---|---|---|---|---|
| Average length of employment | male | year | 13.2 | 13.8 | 13.8 | 13.6 | 13.6 |
| woman | year | 13.1 | 13.6 | 13.6 | 13.0 | 12.8 | |
| total | year | 13.2 | 13.7 | 13.7 | 13.4 | 13.4 | |
| Average paid leave utilization rate | % | 64.7 | 70.6 | 70.0 | 73.1 | 75.5 | |
| Average number of paid holidays taken | day | 11.3 | 12.5 | 12.2 | 12.6 | 12.8 | |
| Actual annual working hours | time | 2,065 | 1,888 | 2,216 | 1,879 | 1,888 | |
| Average monthly overtime hours *1 | time | 24.4 | 24.4 | 23.1 | 21.7 | 20.5 | |
| Childcare leave acquisition rate | male | % | - *2 | 16.7 | 50.0 | 57.1 | 64.3 |
| woman | % | 100.0 | 100.0 | 100.0 | 100.0 | 100.0 | |
| Average number of days of childcare leave taken | male | day | - | 31 | 34 | 38 | 44 |
| Continuing employment rate after childcare leave | % | 100.0 | 100.0 | 100.0 | 100.0 | 100.0 | |
| Average training cost (per employee) | 10,000 yen/year | 18 | 20 | 20 | 18 | 17 | |
| Average annual salary | whole | 10,000 yen | 723 | 718 | 768 | 742 | 744 |
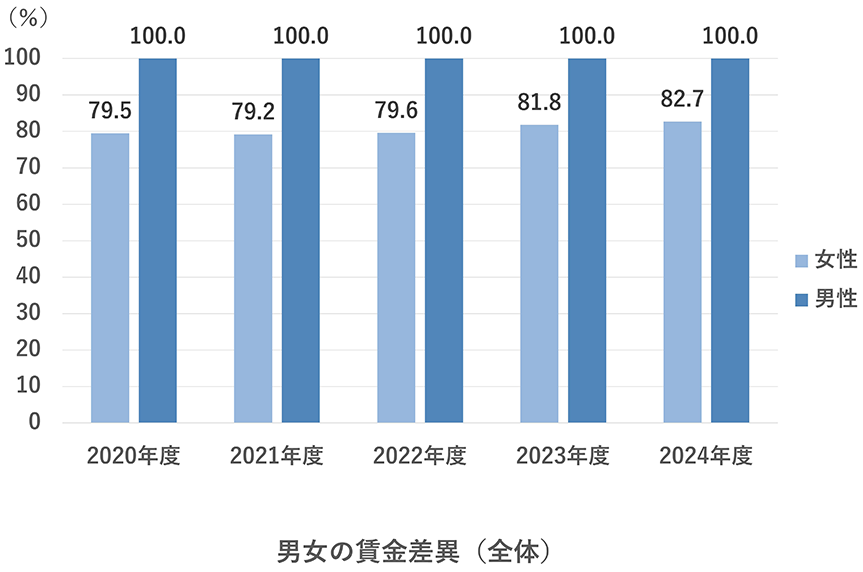
| Gender wage gap | whole | % | 79.5 | 79.2 | 79.6 | 81.8 | 82.7 |
| (of which) Regular employees | % | 80.0 | 79.9 | 80.4 | 82.6 | 83.3 | |
| (including) non-regular workers | % | 76.1 | 75.5 | 29.0 | 74.8 | 73.9 | |
| turnover rate | whole | % | 7.3 | 9.6 | 5.4 | 5.2 | 5.7 |
| male | % | 7.4 | 10.7 | 5.1 | 4.6 | 4.8 | |
| woman | % | 7.1 | 6.4 | 6.2 | 6.8 | 5.4 | |
| Occupational accident frequency rate | % | 0 | 0 | 0 | 0 | 0 | |
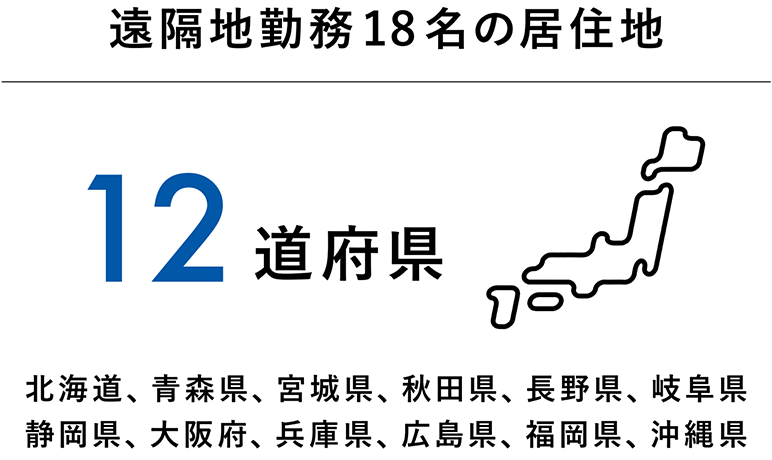
| Number of people using the remote work system | people | - | - | 2 | 15 | 18 | |
- 1 Calculated value based on a standard working time of 7.5 hours
- 2. 2020: No recipients
Health and Productivity Management
| item | unit | 2020 | 2021 | 2022 | 2023 | FY2024 | |
|---|---|---|---|---|---|---|---|
| Measures against lifestyle-related diseases | Regular health checkup attendance rate | % | 100 | 100 | 100 | 100 | 100 |
| Health checkup attendance rate | % | 98.8 | 97.1 | 97.6 | 97.9 | 96.4 | |
| Mental health measures | Stress check participation rate | % | 96.5 | 86.9 | 92.4 | 92.1 | 95.0 |
| Engagement survey response rate (data coverage rate) | % | 94 | 95 | 95 | 97 | 97 | |
| Engagement metrics * | Score | 68 | 68 | 68 | 68 | 68 | |
- Median survey score: 57
environment
environment
| item | unit | 2020 | 2021 | 2022 | 2023 | FY2024 | |
|---|---|---|---|---|---|---|---|
| Total energy input (fuel) | GJ | - | 103.90 | 174.55 | 192.67 | 200.72 | |
| Energy consumption (power consumption) | GWh | - | 6.56 | 5.63 | 5.49 | 4.65 | |
| Renewable energy electricity ratio | % | - | - | 8.9 | 9.0 | 20.6 | |
| Waste emissions (Akasaka Head Office only) | t | - | - | - | 8.8 | 9.6 | |
- Calculated figures for our company alone
| GHG emissions | unit | 2020 | 2021 | 2022 | 2023 | FY2024 | |
|---|---|---|---|---|---|---|---|
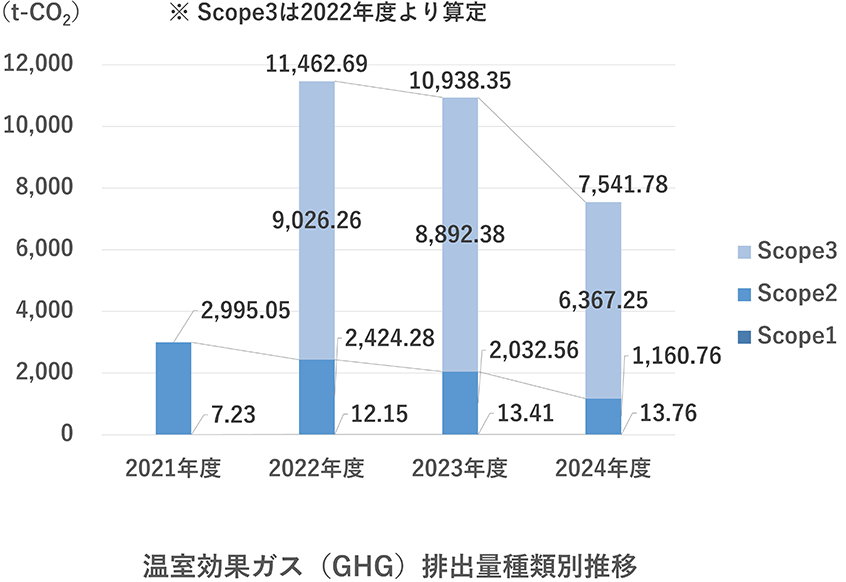
| Scope1 | Direct greenhouse gas emissions by businesses themselves | t-CO2 | - | 7.23 | 12.15 | 13.41 | 13.76 |
| Scope 2 (Market Standard) |
Indirect emissions from the use of electricity, heat, and steam supplied by other companies | - | 2,995.05 | 2,424.28 | 2,032.56 | 1,160.76 | |
| Scope 2 (Location criteria) |
- | - | - | - | 1,966.72 | ||
| Scope 1 + Scope 2 (market standard) subtotal | - | 3,002.29 | 2,436.43 | 2,045.97 | 1,174.52 | ||
| Scope 1 + Scope 2 (location-based) subtotal | - | - | - | - | 1,980.49 | ||
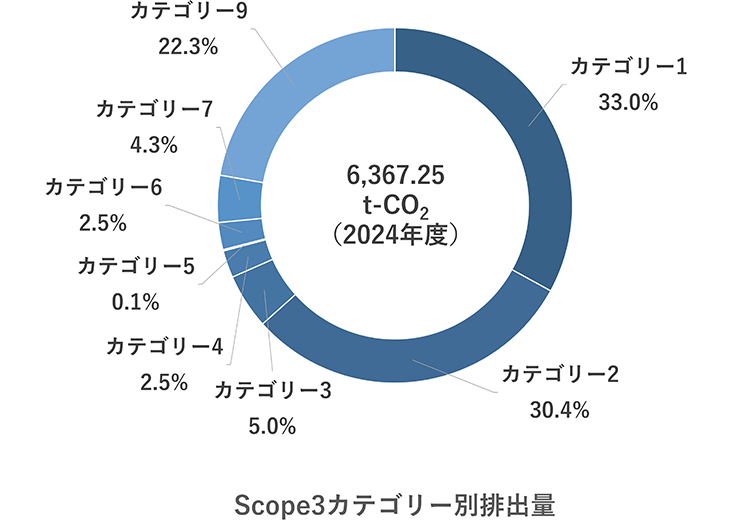
| Category 1 | Purchased products and services | - | - | 3,155.52 | 3,286.90 | 2,099.95 | |
| Category 2 | capital goods | - | - | 2,569.03 | 2,156.13 | 1,935.58 | |
| Category 3 | Fuel and energy-related activities not included in Scope 1 and Scope 2 | - | - | 384.27 | 374.44 | 319.25 | |
| Category 4 | Transportation and distribution (upstream) | - | - | 41.42 | 32.13 | 157.54 | |
| Category 5 | Waste generated from business | - | - | 6.76 | 6.27 | 7.87 | |
| Category 6 | business trip | - | - | 128.43 | 145.73 | 157.24 | |
| Category 7 | Employee commuting | - | - | 137.76 | 162.83 | 271.79 | |
| Category 8 | Leased assets (upstream) | - | - | - | - | - | |
| Category 9 | Transportation and distribution (downstream) | - | - | 2,603.09 | 2,727.95 | 1,418.04 | |
| Category 10 | Processing of sold products | - | - | - | - | - | |
| Category 11 | Use of sold products | - | - | - | - | - | |
| Category 12 | Disposal of sold products | - | - | - | - | - | |
| Category 13 | Leased assets (downstream) | - | - | - | - | - | |
| Category 14 | franchise | - | - | - | - | - | |
| Category 15 | investment | - | - | - | - | - | |
| Scope3 | Indirect emissions other than Scope 1 and Scope 2 (emissions by other companies related to the activities of the company) | - | - | 9,026.26 | 8,892.38 | 6,367.25 | |
| Scope 1, 2, and 3 total (supply chain emissions) | - | - | 11,462.69 | 10,938.35 | 7,541.78 | ||
| Emissions intensity (Scope 1 and 2/sales) | t-CO2e /million yen |
- | 0.1297 | 0.1025 | 0.0869 | 0.0489 | |
- Calculated figures for our company alone
- Starting from fiscal 2024, we will change the method of calculating greenhouse gas emissions and adopt the total emissions allocation method for some Scope 3 categories.
Governance
Corporate Governance
| item | unit | 2020 | 2021 | 2022 | 2023 | FY2024 | |
|---|---|---|---|---|---|---|---|
| board of directors | Number of times held | times | 18 | 19 | 20 | 17 | 18 |
| Number of directors | whole | people | 8 | 8 | 9 | 9 | 9 |
| Independent Outside Directors | people | 4 | 4 | 3 | 2 | 2 | |
| Ratio of independent outside directors | % | 50.0 | 50.0 | 33.3 | 22.2 | 22.2 | |
| Female directors | people | 1 | 1 | 0 | 2 | 2 | |
| Ratio of female directors | % | 12.5 | 12.5 | 0.0 | 22.2 | 22.2 | |
| Nomination and Compensation Committee | Number of times held | times | 6 | 8 | 8 | 8 | 12 |
| Number of people | people | 5 | 5 | 4 | 3 | 3 | |
| (Of which) Outside Directors | people | 4 | 4 | 3 | 2 | 2 | |
| Ratio of Outside Directors | % | 80.0 | 80.0 | 75.0 | 66.7 | 66.7 | |
| Governance Committee | Number of people | people | 3 | 3 | 3 | 3 | 3 |
| (Of which) Outside Directors | people | 1 | 1 | 1 | 1 | 1 | |
| Ratio of Outside Directors | % | 33.3 | 33.3 | 33.3 | 33.3 | 33.3 | |
| Board of Auditors | Number of times held | times | 13 | 14 | 14 | 14 | 14 |
| Number of people | people | 3 | 3 | 3 | 4 | 3 | |
| (including) Outside Audit & Supervisory Board Members | people | 3 | 3 | 3 | 3 | 2 | |
| Ratio of Outside Auditors | % | 100.0 | 100.0 | 100.0 | 75.0 | 66.7 | |
| Female Audit & Supervisory Board Members | people | - | - | - | - | - | |
| Ratio of female auditors | % | - | - | - | - | - | |
| Directors' Remuneration (Excluding outside directors) |
Total amount of remuneration, etc. | 1,000 yen | - | - | - | 130,411 | 130,008 |
| (within) Basic remuneration + Executive Officer Remuneration: Basic Remuneration |
1,000 yen | - | - | - | 129,035 | 130,008 | |
| Executive Officer Remuneration: Performance-linked Remuneration | 1,000 yen | - | - | - | 1,375 | - | |
| Number of applicable executives | people | - | - | - | 5 | 4 | |
| Audit & Supervisory Board Member Remuneration (Excluding outside auditors) |
Total amount of remuneration, etc. | 1,000 yen | - | - | - | 10,800 | 14,160 |
| (within) Basic remuneration | 1,000 yen | - | - | - | 10,800 | 14,160 | |
| Bonuses | 1,000 yen | - | - | - | - | - | |
| Number of applicable executives | people | - | - | - | 1 | 1 | |
| Outside Director Remuneration | Total amount of remuneration, etc. | 1,000 yen | - | - | - | 43,377 | 30,540 |
| (within) Basic remuneration | 1,000 yen | - | - | - | 43,377 | 30,540 | |
| Bonuses | 1,000 yen | - | - | - | - | - | |
| Number of applicable executives | people | - | - | - | 8 | 5 | |
IR activities
| item | unit | 2020 | 2021 | 2022 | 2023 | FY2024 |
|---|---|---|---|---|---|---|
| Financial Results Briefing | times | 2 | 2 | 2 | 2 | 2 |
compliance
| item | unit | 2020 | 2021 | 2022 | 2023 | FY2024 |
|---|---|---|---|---|---|---|
| Number of compliance training sessions held | subject | - | - | 6 | 6 | 6 |
Status of each conference in 2024
- Event status from April 1, 2024 to March 31, 2025
- Those who joined or left the company during the period will be noted in the notes.
【board of directors】
| Number of meetings attended/number of meetings held (attendance rate) | |
|---|---|
| Makoto Hayama | 18/18 (100%) |
| Seiji Ishida | 18/18 (100%) |
| Yoshihisa Yamamoto | 18/18 (100%) |
| Masafumi Fujiuchi | 18/18 (100%) |
| Kazutoshi Ono | 17/18 times (94%) |
| Manabu Yano | 4 times/4 times (100%) |
| Yoshimasa Nagase | 14/14 times (100%) |
| Manyan Mariko | 18/18 (100%) |
| Haruhi Kuroda | 18/18 (100%) |
- At the 55th Ordinary General Meeting of Shareholders to be held on June 18, 2024, Yoshimasa Nagase will be appointed as a Director, and Manabu Yano will retire as a Director.
[Nomination and Compensation Committee]
| full name | Number of meetings attended/number of meetings held (attendance rate) |
|---|---|
| Makoto Hayama | 11/12 times (92%) |
| Manyan Mariko | 12 times/12 times (100%) |
| Haruhi Kuroda | 12 times/12 times (100%) |
[Board of Auditors]
| full name | Number of meetings attended/number of meetings held (attendance rate) |
|---|---|
| Kyosuke Togano | 14/14 times (100%) |
| Norihisa Ogawa | 14/14 times (100%) |
| Takahiro Kobayashi | 14/14 times (100%) |