Data Utilization Course by Professor Mai Sato, Lesson 3: "What kind of statistics is useful for data utilization?"
last timeContinued from
(The first lessonHere)

Lecturer: Mai Sato
▼Profile
Mai Sato is a data utilization consultant. She is the representative partner of Delta Create LLC and a member of the Marketing Science Society. Her introductory book on data utilization and statistics, "First Statistics: Which Line Moves Faster at the Cash Register?!" (Sogo Horei Publishing), has been ranked number one in many bookstores.
*Titles and affiliations are those at the time of interview.
LESSON 1 explanation video by Mai Sato
What kind of statistics can help you use data?
In the previous lessons, we explained the benefits and key points of using data, as well as an overview of data analysis methods. In this lesson, we will explain the basic knowledge of statistics, which will be the common language when conducting business through data-based communication. The goal of this lesson is to
- Intuitively understand difficult statistics
- Acquire the minimum common language necessary for utilizing data
There are two types:
It's very common for people to be assigned to work with data within a company, but end up giving up even after reading introductory books, attending university lectures, and participating in seminars. This lesson aims to first give you an intuitive understanding of statistics, and then help you acquire the bare minimum of common language. And this "bare minimum" is actually the essential part. If you can master this, you'll be able to acquire the key points necessary for conversation, so I hope you'll make sure to take in the information properly.
1. What is statistics useful for?
Many people start learning statistics, but halfway through, they start to wonder, "What is the use of this, anyway?" So before we talk about the basics of statistics, let's talk about situations in which the power of statistics is put to use, linking it to a business context.
The role of statistics can be divided into two parts:
- By analyzing the numerical data obtained from observing (surveys, experiments, etc.) various phenomena, whether natural or social, one can discover some kind of law in the phenomenon.
- Because it is highly objective, it can be used as a basis for claims regardless of field.
The role of statistics is to create a basis for making decisions based on data and numbers. I think you can think of statistics as a kind of compass that helps you reach consensus across the entire organization and make decisions with confidence.
Let's take a look at a specific business scenario where statistics can be useful. It's common to give a presentation within your company saying, "I think if we implement this measure, sales will increase." When asked, "That's a good idea, but do you have any evidence?" You can only answer, "I won't know until I try it." Many of you have probably had this experience. Without knowledge of statistics, you may not be able to provide quantitative evidence for your plan or proposal, and end up failing to convince the other party. Also, when an expert explains a report, you may not understand the meaning of each number and be unable to ask questions. Or, you may blindly accept the expert's opinion and take it back to your company, only to find yourself unable to translate the content.

If any of these apply to you, I think studying statistics will be useful. However, there is one thing you should be careful of when studying statistics. That is, set learning goals that fit your own sense of challenges. You don't need to become an expert, but if you want to handle data and numbers in a business setting,
- Able to roughly read and understand reports issued by experts, ask appropriate questions, exchange opinions, and act as an interpreter within the company
- Become aware of the potential tricks in numbers and avoid being fooled
- Be able to provide statistical evidence to support your claims
- You can find some discoveries or ideas from the data.
These four points are your goals. The video for this lesson explains goal setting from the perspective of "depth x breadth of learning," so if you're interested, please take a look. In order to master these four points, this lesson will aim to help you acquire the following: "1. Be able to roughly read and understand reports issued by experts, ask appropriate questions, exchange opinions, and act as an interpreter within the company." There are no mathematical formulas or anything like that, so even those who are not good at math should be able to follow along with ease.
2. Basic Terms in Statistics
In order to publicly state that our company utilizes data, it is important to understand at least some statistical terminology and to avoid misuse. Here we will explain the terms that are frequently used.
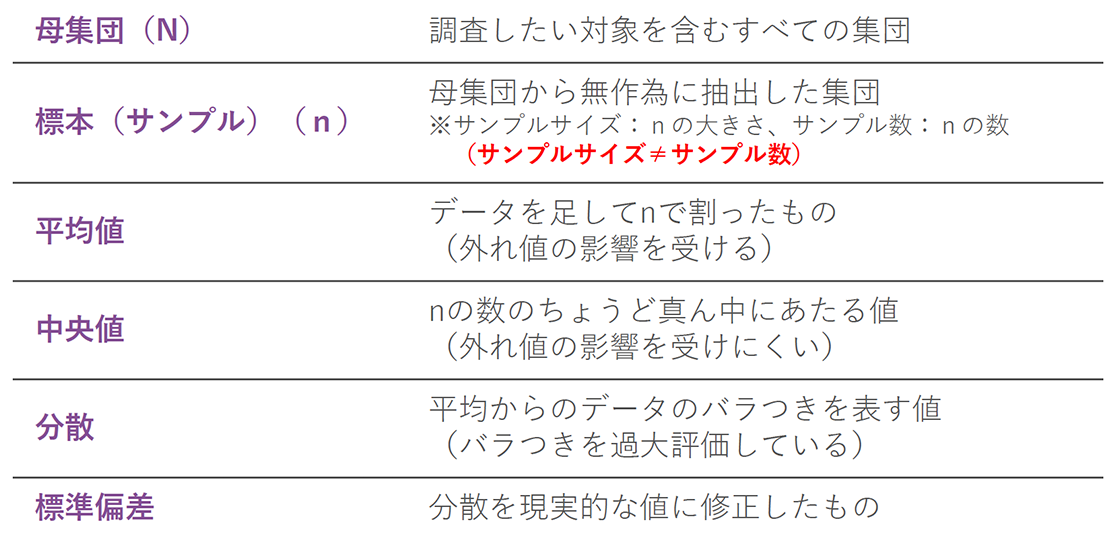
- "Population (N)": All populations that include the subjects you want to investigate
This refers to everything that is included in the subject you want to know about. For example, if you want to know whether men are taller than women, your population would be "everyone in the world."
next
- Sample (n): A group randomly selected from the population
This is about. Even if you want to know about height, it is difficult to collect data on the height of people all over the world. In that case, you need to collect data from several people and verify it. Data randomly extracted from a population is called a sample. There are also two ways to count this sample,
- Sample size: how large is n?
- Number of samples: number of n
In the previous example, if 1,000 people were selected, the sample size would be 1,000. We will discuss sample size later, but first, remember that sample size and sample number are different things.
- Mean: sum of data divided by n (affected by outliers)
- Median: The value that is exactly in the middle of the number of n (samples) (less susceptible to outliers)
The differences between these two will be discussed in more detail later.
- Variance: A value that represents the dispersion of data from the mean (overestimating dispersion)
- Standard deviation: Variance corrected to a realistic value
Some people may find variance and standard deviation confusing, but simply put, they both represent the "scattering of data." For example, if there are two groups and the average height of both groups is the same,
Group A: All members are between 155cm and 165cm
Group B: All members are between 140cm and 180cm
In this case, although the mean values are the same, it seems that the variance of the data is somehow greater for Group B. The indicators that measure the degree of variance of data from the mean are variance and standard deviation. We won't go into detail about variance and standard deviation in this lesson, but it's important to remember that there are indicators that show the variability of data in addition to the mean.
In addition, what is called statistical data in the world,
Descriptive statistics: A clear summary of the data collected
Inferential statistics: Attempts to infer characteristics or properties of an entire population based on a sample
There are two types of statistics: descriptive statistics, which use the mean, standard deviation, maximum, and minimum values to estimate the population based on the results of a sample, and inferential statistics, which use the results of a sample to estimate the population. An example of descriptive statistics is the Ministry of Health, Labor, and Welfare's Basic Survey on Living Conditions (2019). This data shows the income of each household and is represented using a histogram, a common statistical method. While the average income in this data is listed as ¥5,523,000, the graph shows that 61.1% of people earn below the average income. As can be seen, the average is not roughly the middle value of the population. This average income is influenced by the data of high-income households. The disadvantage of the average is that it is easily influenced by outliers, which are data that deviate from the average. Therefore, for data with unlimited limits, such as income, savings, and unit prices, we recommend using the median.

Now that we have a grasp of basic terminology, we will explain statistical terms that are easily misused. The most common misuse by far is when other terms are used to mean sample size. Sample size is a term that indicates the amount of data to be surveyed, but a similar term is sample size. For example, if you want to compare the average height of Japanese people with the average height of Americans,
Sample: Randomly selected representatives of Japanese people (1,000 people) and Americans (1,000 people)
Sample size: 2,000 people
Number of samples: 2
In other words, the sample size is 2, which is the number of groups, Japanese and Americans. There are also cases where the sample size is misused as the population size,
(See the video for examples of misuse.)
Sample size ≠ number of samples ≠ population
Let's keep this in mind.
3. What does "statistically significant" mean?
What does "statistically significant" mean? Before explaining this, let's first talk about what an "effect" is.
Effect: In a word, difference
For example, advertising claims such as "Using this machine for one month will result in an average weight loss of 2 kg" or "Implementing this system will increase average conversions by 10%" are touting effectiveness. In recent years, the way such claims, which express effectiveness through objective figures and attempt to gain consumer trust, have come under scrutiny. Advertising is a prime example. I myself am often approached by advertising agencies and asked, "Is statistical proof necessary even though I'm not writing a research paper?" However, statistical proof is necessary for both the decision-makers (so can I use this service?) and the product/service providers (is this evidence sufficient?).
From the perspective of the decision maker, let's say an advertiser is running a web ad and is undecided between design A and design B. In this case, they might think that A had a better response rate, meaning that there was a difference between A and B and that it was effective. However, they must clarify whether that difference is actually an error and whether the sample size is appropriate.
In this regard, I will briefly explain how to determine whether it is effective or not.
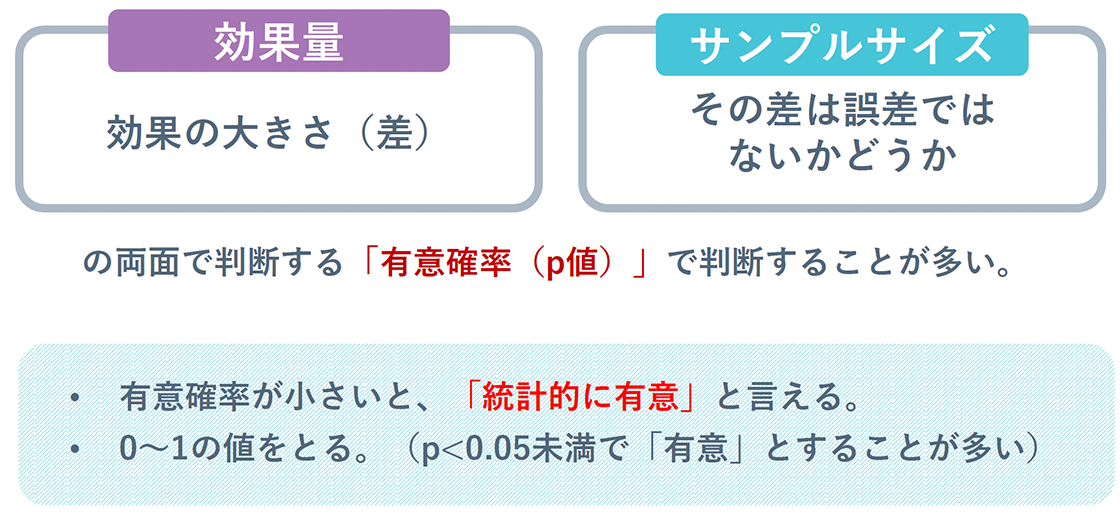
Effect size: the size of the effect (difference)
Sample size: Is the difference an error?
By focusing on both aspects, you can determine whether it is effective or not.
Probability of significance (p-value)
This value is published in most reports and papers that perform statistical analysis. This significance probability ranges from 0 to 1, and the smaller this value, the more "statistically significant" it is (in most cases, anything less than 0.05 is considered "significant").
On the other hand, when it comes to advertising agencies, the providers of products and services, who require statistical proof, landing page screening is becoming stricter every year, making it difficult to use outliers when showing before and after images. Rather than outliers, it is necessary to display data that is within a reasonable range of probability and that can be applied to the general public. The video explains this using diet ads as an example, so if you're interested, please take a look.
In other words, just because numbers are listed does not necessarily mean they are evidence. We need to be aware that we are now in an age where it is essential to question and present statistically accurate information.
Regarding the significance probability mentioned above, there is a mathematical trap in that even if the effect size is the same, the significance probability becomes smaller as the sample size becomes larger, making it easier for the effect to be "statistically significant." We do not recommend taking advantage of this property and continuing to collect data until the significance probability becomes smaller in order to support your claim. What is important is to check not only the significance probability, but also the effect size, which is an indicator of how big the effect is in the first place. Finally, I would like to introduce just one easy-to-understand indicator of effect size.
4. Correlation and Causation
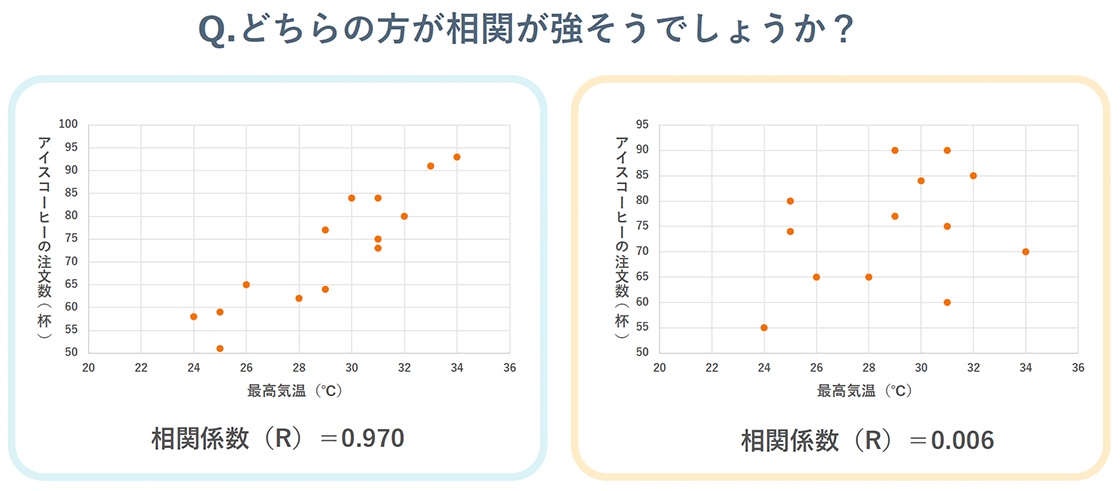
Correlation expresses the degree of relationship between two values. I'm sure you've all heard the phrase "these numbers are correlated..." at some point. For example, when height and weight are plotted on a scatter plot, if a linear trend is observed that rises to the right, then height and weight can be said to have a positive correlation. Conversely, if one increases as the other decreases, then this linear trend is called a negative correlation.
Furthermore, the numerical value of the strength of a correlation in a correlational relationship like this is called the correlation coefficient. This correlation coefficient is one of the effect sizes, which is an indicator of the magnitude of the effect. The correlation coefficient takes values from -1 to 1, and the closer the absolute value is to 1, the stronger the correlation. As a guideline, a value of 0.4 to 0.5 or higher is often considered to be a strong correlation.
Correlation coefficients are often used in business situations, but there is one thing you should be careful about.
Correlation ≠ Causation
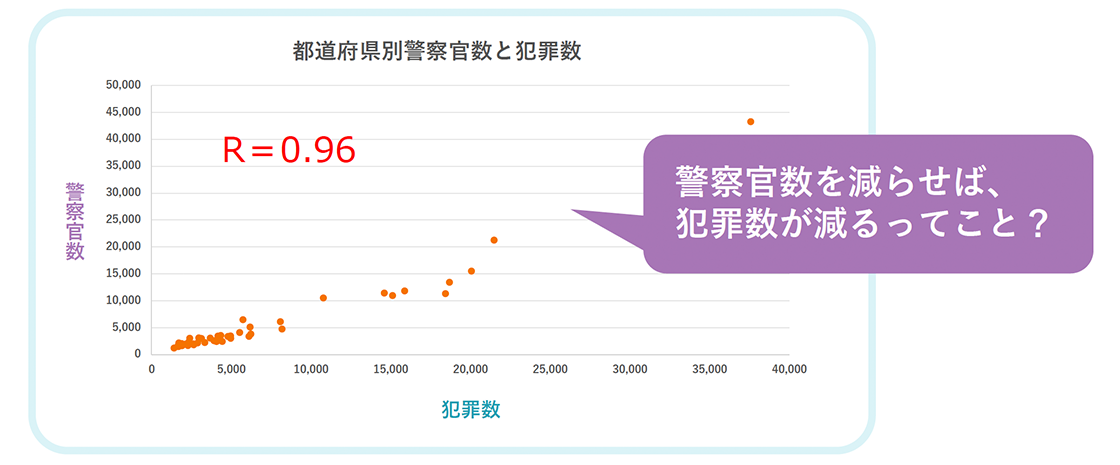
That is what it means. Correlation is merely an indicator of the linkage between two values, and is different from causality, where changing one value will also change the other value. For example, when you see data that shows that prefectures with a large number of police officers have a high number of crimes, some people may think, "Does this mean that reducing the number of police officers will reduce the number of crimes?" However, to put it another way, if you ask whether reducing the number of police officers will result in a decrease in the number of crimes, the answer is no. If you look at examples like this,
Spurious correlation: When two events are not (or may not be) related to each other, it is assumed that there is a causal relationship due to an unseen factor (a latent variable).
This invisible factor corresponds to the population in the example of the number of police officers and the number of crimes. A large population inevitably means a large number of police officers and a large number of crimes, so there is actually a correlation between the number of police officers, the number of crimes, and the population. Correlations are easy to find if you look into them, but they do not necessarily mean that there is a causal relationship, so be careful when interpreting them.
So, what should we do once a correlation has been confirmed? We need to think about what hypotheses can be generated from it.
Most of what we can learn from data is correlation, and conversely, correlation is often the only thing we can learn.
Therefore, I recommend formulating a causal hypothesis from that perspective. Please see Lesson 2 for information on how to formulate hypotheses and problems.
Also, there are techniques for verifying correlation and causation, but the explanation would be lengthy, so if you are interested, please refer to the separate teaching materials.
That's all for today's lesson. Thank you very much.