Creating a dashboard through data integration
Work style reform begins with visualizing "how employees work"

As the working population continues to decline, an increasing number of companies are working to reform their work styles in order to improve productivity. However, they face a variety of hurdles, such as where to start, what tools to use, and how to verify effectiveness, and in many cases, they are unable to achieve the results they hoped for.
In fact, our company was one of those companies until a few years ago, but we started by making all of our internal data open (visualizing it) and undertook various measures such as creating dashboards. As a result, we were able to significantly improve sales and operating profit per person, overtime hours, and the use of telecommuting, and successfully reformed our working style.

Dashboards offer significant benefits in data visualization
To promote work style reform and create a comfortable and rewarding workplace, it is essential to visualize the work behavior of each employee. Our company promotes visualization through various dashboards, such as the "PC Usage Dashboard" that uses PC operation log data, but this time we will introduce two of them: the "Time Attendance Dashboard" and the "Expense Reimbursement Dashboard."
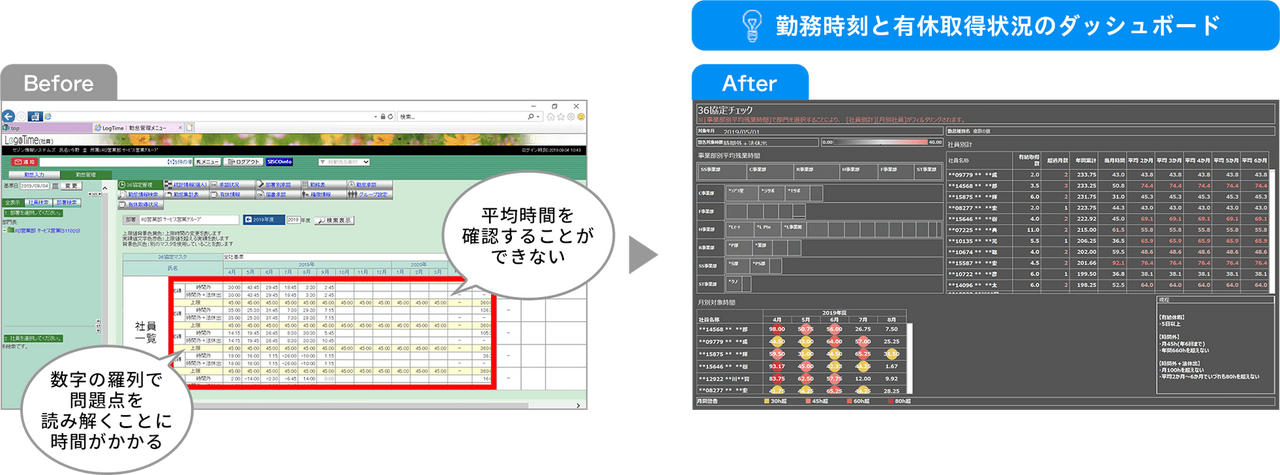
◆Attendance dashboard
Our company manages attendance by having employees clock in and out of work using a web-based attendance system. Department heads and team leaders can check the attendance status of their members on the attendance system, but there were problems such as "it's hard to find problems when you only see a list of numbers," "you can't check by comparing with other departments," and "you can't check the conditions stipulated in the Work Style Reform Act."
To solve these problems, we decided to revamp the attendance dashboard and visualize attendance data using Tableau, a BI tool that excels at visual analysis. This has made it possible to do the following things in attendance management work that were not previously possible:
✓The status of employees who are under a lot of stress, such as those working long hours of overtime, can be checked at a glance, allowing for early care.
✓ You can visualize employee work status across the entire company, regardless of department, and work to level out workloads.
✓You can see at a glance your current status regarding the conditions set out in the Work Style Reform Bill (e.g., number of paid holidays taken per year, average overtime hours, etc.)
Attendance dashboard before ⇒ after
◆Expense reimbursement dashboard
Another thing we created with the aim of visualizing how employees work from the perspective of expense reimbursement is the expense reimbursement dashboard shown below.
Expense Dashboard
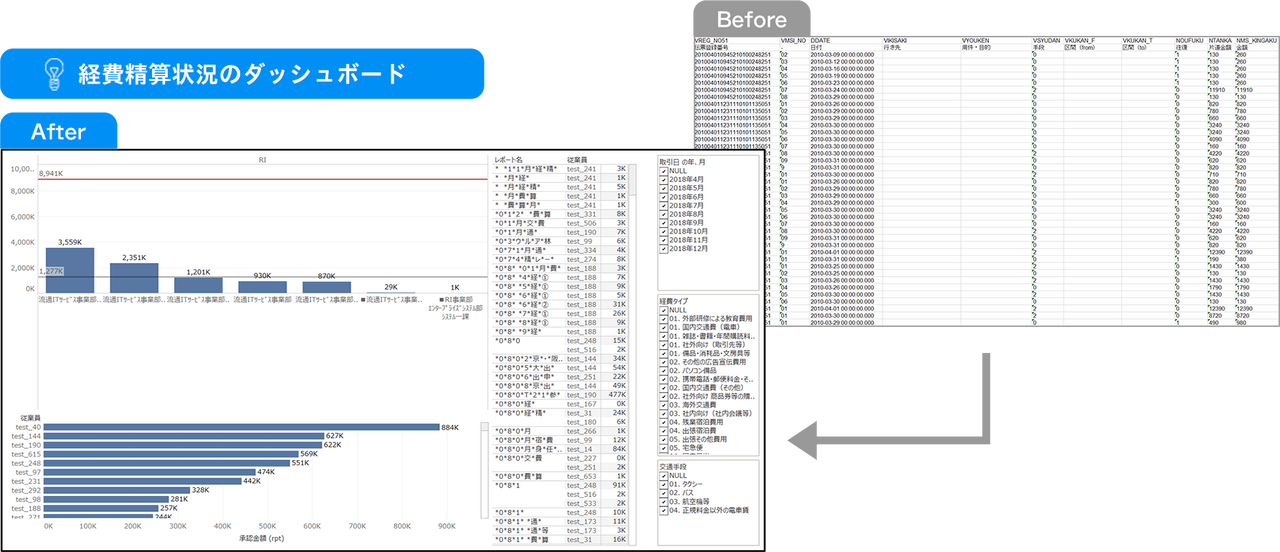
Previously, in response to requests from business divisions, accounting staff would download data from the expense reimbursement system, process it in Excel, and distribute it. However, this process posed problems on both sides, as there was a lead time between the request and confirmation (on the business division side), and manual work was inefficient and prone to errors (on the accounting side).
As a result of creating the expense reimbursement dashboard, the business division was able to check expenses with zero lead time, and the accounting division was freed from the need for manual work each time, bringing great benefits to both parties.
data integration platform essential for creating dashboards
By "visualizing employee work behavior" based on various data such as attendance clock-in data, expense reimbursement data, and PC operation logs, we have created a system that can quickly identify employees with high workloads and provide prompt support. Dashboards also contribute to creating "easy-to-work workplaces" that are friendly to each individual employee and realizing "new work styles" such as free address and teleworking. However, to create dashboards in real time from various data, data integration platform is required to link the systems, databases, Excel files, etc. that use the data. A data data integration platform from various systems makes it possible to check the latest data in real time, eliminates the need for manual data processing, and leads to reduced overtime hours.
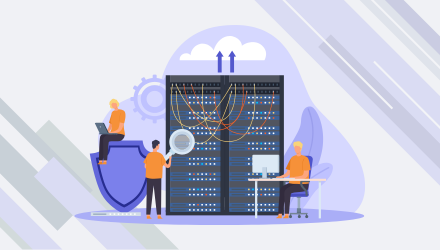
Image of data integration platform

We leverage our experience to provide services for creating dashboards and building data integration platform for our customers. If you are considering creating a dashboard, or would like to know more about the dashboards we actually use, such as the UI and data integration mechanisms, please feel free to contact us.