How can you data integration to maximize MotionBoard's potential?


MotionBoard is a Japanese-made BI (Business Intelligence) tool that centralizes the management of various data within a company and enables advanced visualization and analysis. It visualizes data within a company and allows easy execution of everything from simple aggregation to advanced analysis, and is used by over 3,500 companies across a wide range of industries and sectors.*We have a wealth of implementation experience.
In this article, we will explain the features of MotionBoard and how to integrate it with various data sources both inside and outside your company in order to maximize the potential of MotionBoard's data utilization.
*Cumulative number of companies using the cloud and packaged versions (as of the end of February 2024)
What is MotionBoard?
MotionBoard is provided by WingArc1st Inc., which offers data utilization solutions such as the comprehensive report platform "SVF" and the information analysis platform "Dr.Sum," providing a one-stop system for managing reports and documents, as well as data analysis. By aggregating and graphically visualizing a variety of data with MotionBoard, users at a wide range of levels, from field staff to executives, can grasp and share the current situation, which is expected to dramatically improve cross-departmental collaboration and the speed of decision-making.
MotionBoard Features
MotionBoard is a BI tool that goes beyond data analysis to consolidate and visualize data scattered throughout a company, leading to the actions required for business. Let's take a look at what kind of BI tool MotionBoard is and its features.
Integration with a wide range of data sources
MotionBoard can connect with a wide range of data sources, both inside and outside the company. It can perform cross-sectional analysis of data with different structures, such as databases, files, cloud services, sensor data, and location information, helping you make speedy decisions.
Rich features
Another major feature is that it has a wide range of functions that other BI tools do not have, such as alert notifications, email sending, and creating and printing standard reports.
Furthermore, MotionBoard allows you to input data into Salesforce and other databases, seamlessly completing the entire process from input to analysis to report creation, which sets it apart from other BI tools.
Easy to use for everyone from management to field staff
Leveraging our many years of experience supporting the business operations of Japanese companies, the user interface and supporting documentation have been designed to be easy to use for a wide range of users, from field staff to management.
In addition to basic charts and summary tables, a wide variety of charts are provided, including Pareto charts, heat maps, scatter plots, radars, and waterfall charts, allowing you to create dashboards without programming.
Examples of MotionBoard usage
MotionBoard has been introduced in a wide variety of industries and business processes, and we would like to introduce some specific examples of its use.
Visualization of manufacturing site operation status and inventory management
Utilizing sensor data is suitable for understanding line operation rates, product defect rates, etc. in real time. When abnormal values are detected, an alert is sent, allowing for swift action to be taken.
In terms of inventory management, by incorporating inbound and outbound data, ideal inventory levels and lead times can be visualized at all times, making it easier to control excess inventory and stockout risks.
It also supports wide-area management across multiple factories and warehouses, allowing you to view the status of each location on a single dashboard.
Marketing trade area analysis and customer data processing
By utilizing the trade area analysis function, it becomes easier to understand store opening strategies and sales trends by area. Map integration also makes it possible to combine information such as population density and traffic volume.
By managing customer data centrally, you can analyze purchase history, campaign response rates, and other data to develop highly accurate marketing strategies. You can implement more effective sales promotions based on the attributes and behavioral history of your target demographic.
These data-based initiatives not only lead to increased sales and improved customer satisfaction, but also contribute greatly to strengthening brand power.
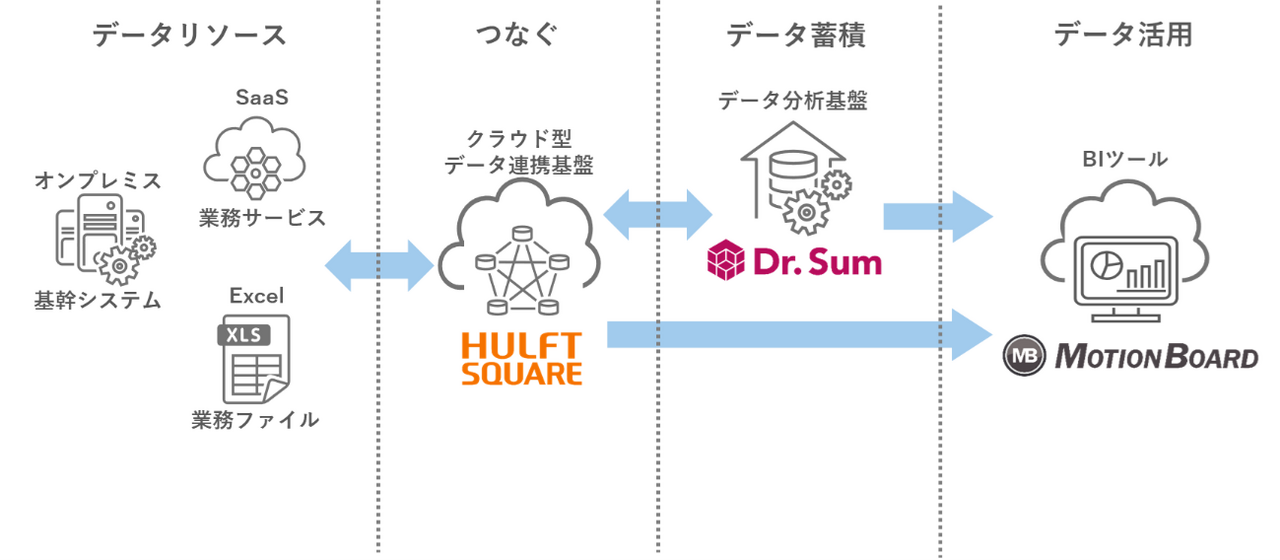
Building a data infrastructure through collaboration between MotionBoard and Dr.Sum
As data utilization advances, the amount of data handled and the types of data sources increase. MotionBoard can be integrated with a wide range of data sources, both internal and external to the company, but to utilize large amounts of data more efficiently and perform multifaceted analysis, it is effective to build a data infrastructure in conjunction with other solutions such as Dr.Sum. The necessity and components of a data infrastructure are explained in the article below.
▼I want to know more about the data infrastructure
⇒ "What is a data infrastructure? Integrating internal and external data and driving its utilization"
Data collection and processing

Data collection is the process of acquiring and centralizing data from a wide variety of sources, such as sensor information, website activity history, and internal mission-critical system, core system. The key here is to build a system that can efficiently and stably capture data.
The area of data processing is responsible for the process of converting collected data into a state that can be analyzed. The necessary data is separated in the extraction stage, and cleansing and format conversion are performed in the conversion stage. Examples of tools that can be used for data collection and processing include the following:
Dr.Sum Connect
This tool allows you to implement data processing flows without programming by combining connection connectors that support various data sources with a wide range of logic icons.It is an easy-to-use tool even for beginners, as it allows you to define complex processes that cannot be written using simple SQL using a GUI.
Dr.Sum DataLoader
You can perform synchronization processes (addition, update, deletion) with the linked database. You can also update only the differential data based on specified key items. This is a recommended function for data that is updated frequently or when data integration.
Data accumulation
A "data warehouse (DWH)" is used to store processed and structured data for analysis and reporting. Furthermore, a "data mart" is a storage location for data extracted from a data warehouse and related to a specific business department (e.g., marketing, human resources, finance, etc.).
By storing data in a consistent format in a DWH or data mart, users can access the data with peace of mind.
▼I want to know more about DWH
⇒ DWH|Glossary
Dr.Sum
"Dr.Sum" is an information analysis platform that can be used to build DWHs and data marts. Its patented proprietary database allows for high-speed aggregation of large volumes of data, so even large companies can operate it without worrying about performance issues.No-code developmentAnother feature is the settings/operation screen which allows you to do the following.
How to efficiently link data to MotionBoard and Dr.Sum
As explained in the previous chapter, when configuring a data infrastructure using MotionBoard and Dr.Sum, mechanisms are provided for collecting and processing data from each data source, such as Dr.Sum Connect and Dr.Sum DataLoader.
If you want to unify data integration data integration with your data infrastructure, one approach is to use iPaaS (Integration Platform as a Service).
▼I want to know more about iPaaS
⇒ iPaaS | Glossary
Leveraging iPaaS
iPaaS (Integration Platform as a Service) is a cloud-based platform for efficiently integrating different applications and systems. Using this platform as data integration platform makes it easier to manage the entire business process, and is expected to reduce operational costs and improve productivity across the organization.
HULFT Square, a Japanese iPaaS, can mutually share data with MotionBoard and Dr.Sum.
Use templates to reduce data collection efforts
HULFT Square provides free application templates that link data with MotionBoard and Dr.Sum. By using these templates, you can eliminate the process of researching specifications, creating scripts, and verifying connections required for linking, automating data collection and reducing the amount of work required by information systems departments.
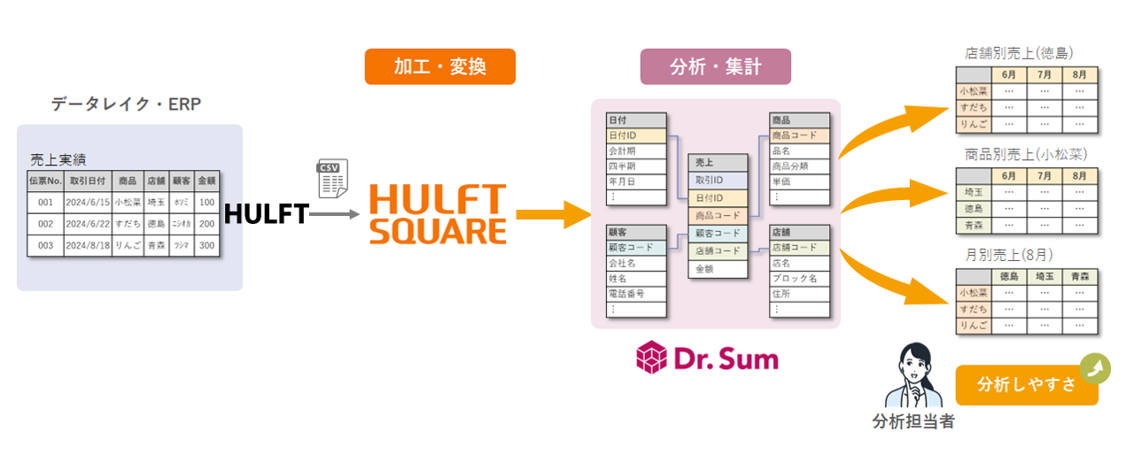
Preparing sales analysis data and linking it to Dr.Sum Cloud
Using sales data analysis as an example, we provide a process to efficiently perform data preprocessing to improve the accuracy of analysis and model building, upload the data to Dr.Sum Cloud, and download the analyzed and aggregated data.
▼I want to know more about templates
⇒ "Preparing target files and uploading them to Dr.Sum Cloud/downloading specified files"
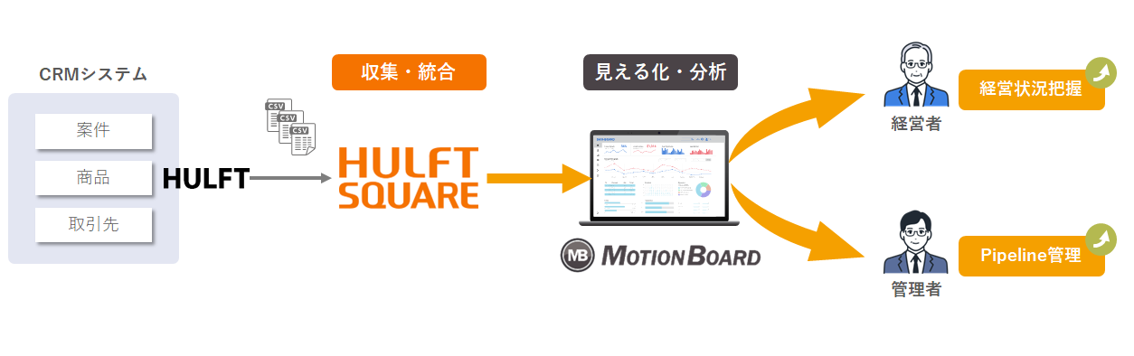
Data integration for pipeline management and sales forecasting
It integrates project information, product information, and customer information managed in CRM, and provides data integration processing for visual analysis of pipeline management and sales forecasts in MotionBoard.
▼I want to know more about templates
⇒ "Upload the project information CSV file to MotionBoard Cloud as a shared CSV file"
summary
MotionBoard is a platform that not only provides basic functions such as visualization and analysis, but also has a wealth of features that other BI tools do not have, expanding the possibilities for data utilization in all areas.
To use MotionBoard more efficiently, it is effective to use it in conjunction with tools such as Dr.Sum. By streamlining the processes of data collection, processing, storage, and visualization and creating an environment where users can access data with peace of mind, MotionBoard's potential can be maximized.
By centralizing data around MotionBoard and aiming to improve organizational decision-making, we will be able to improve corporate competitiveness and create new value.
The person who wrote the article
Recommended Content
-

Why we recommend iPaaS for data integration | A thorough explanation of iPaaS
We will thoroughly explain why iPaaS is suitable for data integration, how it differs from traditional methods, and how it is actually used. -

iPaaS-based data integration platform HULFT Square
iPaaS, data integration platform, is gaining attention in the age of AI. Check out the product details of "HULFT Square," which meets the needs of this era. -

Get an online consultation about data utilization
If you would like to hear more about our data utilization platform, we also offer online consultations.
Related Content
-

Eliminate financial data silos! What is an autonomous decentralized architecture using iPaaS?
-

Data analysis is moving from the BI era to the AI era: Three reasons for accelerating the democratization of data
-

Automated classification of product masters using generative AI: How to bring a new perspective to your analysis