Developer Blog Series Vol. 14 - Data Visualization and Analysis -


Vol.14 2-hour verification: Can the shortage of data talent be made up for by empowering generative AI?
This is the 14th article on data analysis and visualization.
I previously wrote the following in an article titled "AWS re:Invent from an Analytics Perspective."
In Japan, it is difficult to achieve DataQuality due to a shortage of data personnel.
On the other hand, if the cause is a lack of power, it may be possible to change the situation by empowering the generating AI.
So, is that true?
Come to think of it, I haven't verified anything, so I did a little test.
It took me about two hours to test and write the article, so please forgive the low quality.
What is Data Quality?
Data Quality tools/services provide a mechanism for setting thresholds for data and issuing alerts if the data deviates from those thresholds.
Data Quality is a process that utilizes these to ensure data quality.
For information on what to see, please see my previous article, but the main points are the following five.
- Freshness
- Distribution
- Volume
- Schema
- Lineage
Volume is easy to understand.
If the amount of data generated each day is insufficient compared to the amount that should be generated, then something abnormal is likely to have occurred.
The key points are defining the threshold and determining when an alert occurs.
In particular, it seems like it would be a lot of work to make decisions when an alert occurs, as it requires human intervention.
So, let's do a quick test on Volume.
Viewing Quality from a Volume Perspective
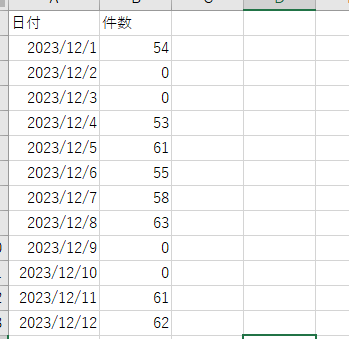
This is the number of posts by date in a Slack channel (including threads).
Since this is a channel for communicating attendance information, there are a fair number of posts on weekdays, but naturally there are almost none on weekends.
*Posts were obtained using Python, converted into a Dataframe, and aggregated.
Using this as the base data, I will ask the generation AI to see if there are any anomalies in the data generated on a certain day.
The generating AI uses our Slack bot.
Incidentally, anomaly detection is primarily an area of expertise for traditional ML, not generative AI.
Although we know that conventional ML can detect outliers, we wanted to see how accurate LLM was in its judgments.
I have tried the prompt below.
Since it's a two-hour test, this is the first prompt that came to mind.
Are the following #data outliers compared to #past history?
- #data
{Data for the day you want to check} - #Past history
{Past month's worth of data}
- prompt
First, we will verify the data from January 17th (57 cases). This is real data.
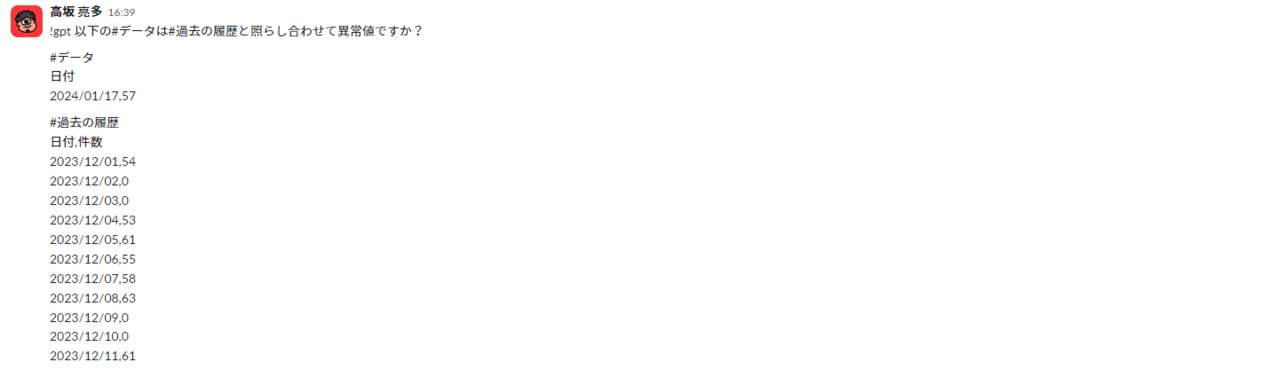
The answer is as follows.
It takes weekends into account too, which is pretty good.
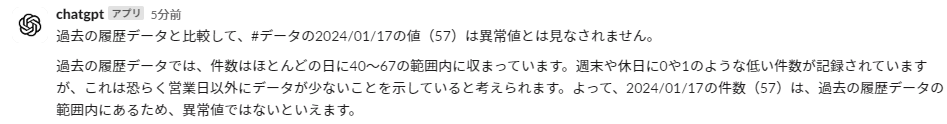
So, I'll ask about the weekend as well. Sunday, January 14th, had zero cases. Anyone can see that this is not an abnormal value.
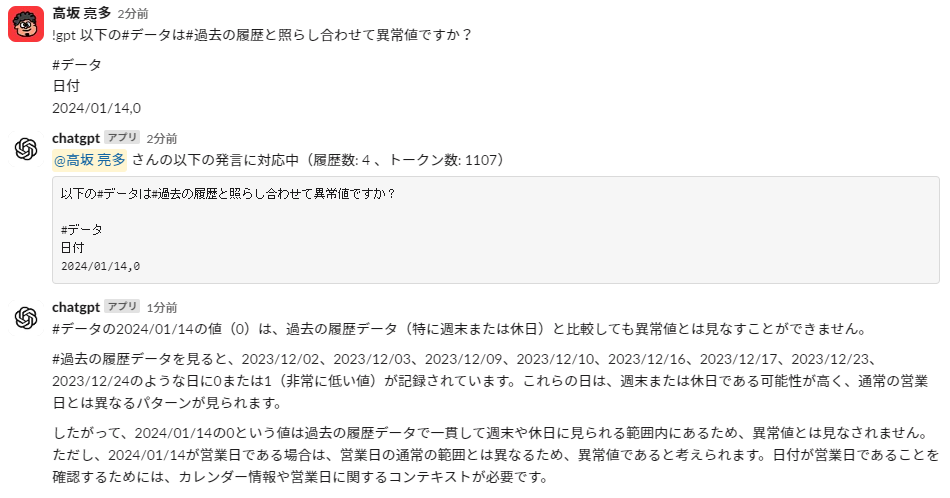
This is also pretty good.
Next, let's pass in fictitious outliers. This is fictitious data with 5 cases of 1/18.
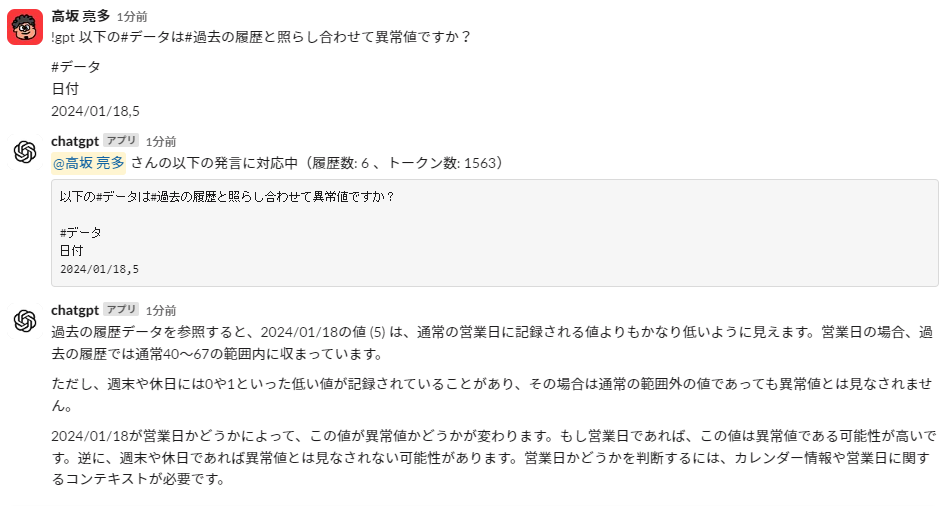
He says a lot, but it seems like he's making the right decisions.
There are a number of points that are correct.
I think the volume part could be useful if we work on it.
Viewing quality from a distribution perspective
Next, let's look at Distribution, which looks at the distribution of data.
Let's look at the distribution of posting users by date.
The prompt is the same as before, except the data content has been changed to aggregated values by date/user.

,,,passing it per date/user seems like too much.
Since this is just a test, I'll try limiting the number of items.
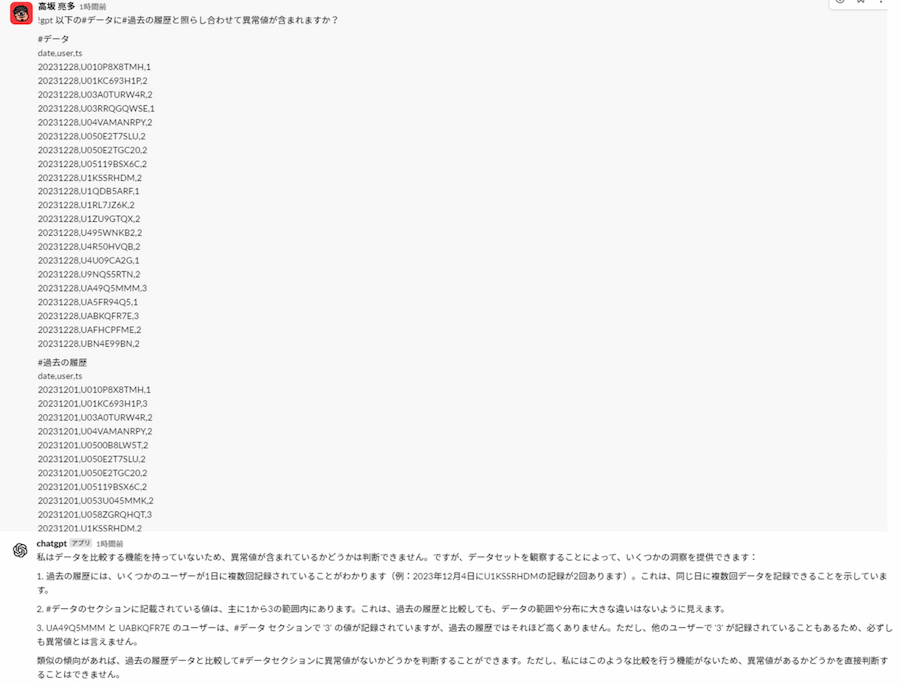
It seems like a pretty good idea, including the idea itself.
This makes me want to work on it a bit more.
summary
So, after doing a quick test, I got the feeling that I could do a little more testing.
I feel like we could create something decent by combining it with traditional ML, which is not generative AI.
Reading the article, it seems as though the detection of anomalies is left to the generative AI, but the point is to see the judgments made after detection.
Actual tools can detect and even identify data that is suspected to be abnormal, so the only thing that needs to be filled in is judgment.
I could have made something a little better and then written an article about it, but I thought that by just going with the flow and releasing it, it might give someone some inspiration.
That's all, thank you for reading to the end.
The person who wrote the article