Data Utilization Course by Professor Mai Sato: Lesson 2: "How do you do data analysis?"
This is a continuation from the first lesson

Lecturer: Mai Sato
▼Profile
Mai Sato is a data utilization consultant. She is the representative partner of Delta Create LLC and a member of the Marketing Science Society. Her introductory book on data utilization and statistics, "First Statistics: Which Line Moves Faster at the Cash Register?!" (Sogo Horei Publishing), has been ranked number one in many bookstores.
*Titles and affiliations are those at the time of interview.
LESSON 1 explanation video by Mai Sato
How do you analyze the data?
In the previous lesson, we explained the benefits of using data, the key points for success, and how to use data effectively. In this lesson, we will explain the challenges and goal setting involved in analyzing data. The goal of this lesson is to:
- Understand the overall picture and flow of data analysis
- Understand the minimum preparations required when working on data analysis
There are two types:
1. Problems when asked to analyze data
First, I'd like to talk about a common problem I encounter when receiving requests for data analysis from clients. This is the request, "We have data, but it's a waste that we're not using it. I'll give you the data, so can you do some analysis from it?" Data analysis is just one process, so simply being asked to "analyze the data" like this doesn't allow for effective use of the data. As I mentioned in the previous lesson, data analysis is done to make "better decisions," so for example,
- Should I choose A or B? I'm not sure which is better.
- The numbers aren't increasing, but I don't know why.
- I want to know the main reason for the success
As you can see, data analysis is only worth doing if there is something you want to know. Please note that it is not something you do because you think the data is a waste. In this regard, I often liken data analysis to solving real puzzles.
"Why does this happen?"
"Aren't these numbers off?"
"Compare it to what?"

Data analysis is meaningful when there's a mystery to solve. Conversely, data analysis alone is pointless without such a mystery. It could even be said that analysis without a mystery is blind. With such a mystery, Excel alone can be used for sufficient data analysis. For example, data analysis can solve the mystery of, "I've been deciding order quantities based on years of intuition and experience, but can I systematize it so that anyone can accurately predict order quantities?" This can be automated. Another example is, "I've been deciding my stock budget allocations haphazardly, but can I systematically manage them to maximize cost-effectiveness while diversifying risk?" This can be solved to calculate the optimal allocation. However, Excel has limitations in its functionality.
- Data analysis exceeding 10,000 digits (approximately)
- Automatically retrieve data
- Use in conjunction with other tools
If you want to do something a little more advanced like this, you will need to consider using a BI tool. Also, by combining a BI tool with data integration tool such as "DataSpider" or "HULFT Square "to obtain the data needed for data analysis with the BI tool, you can perform more detailed data analysis.
2. Skill sets required for data analysis
Next, let's look at the skill sets required for data analysis. This diagram, published by the Data Scientist Association, shows the skill sets in three areas required to become a data scientist.
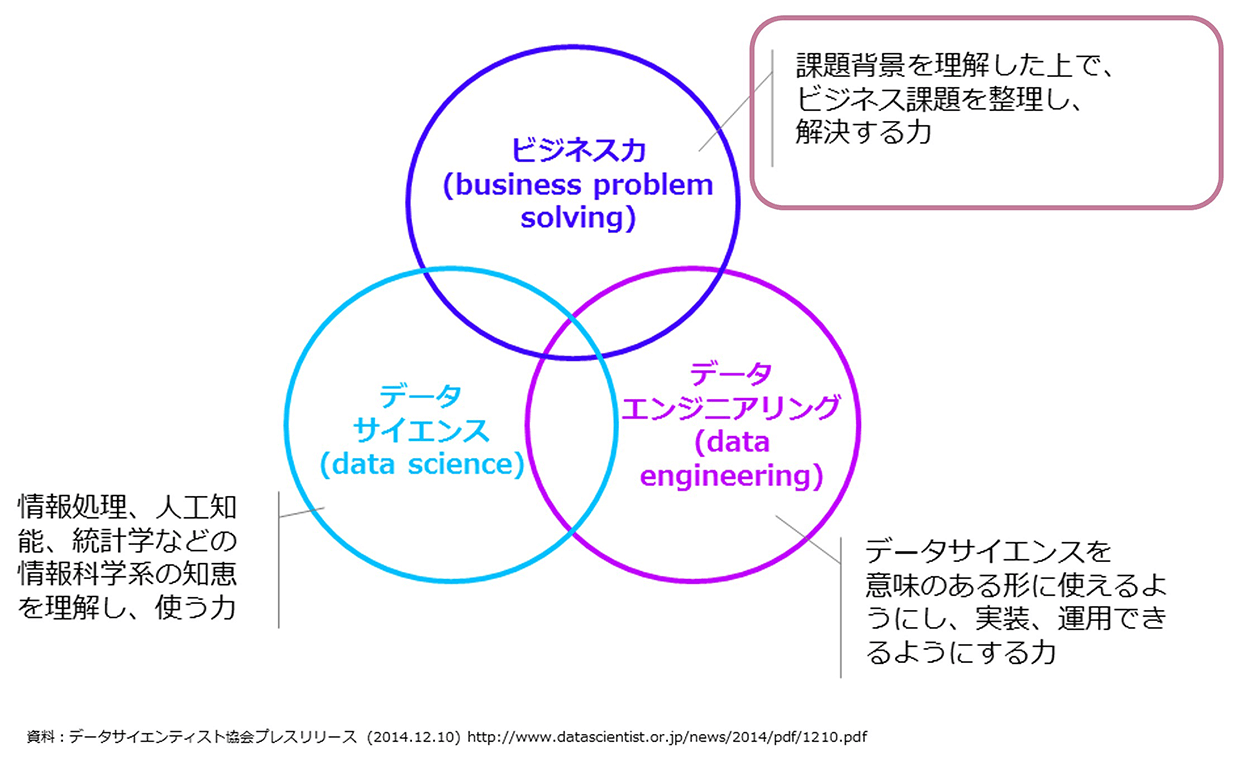
The "Data Science" section on the left represents knowledge of logic such as statistics. The "Data Engineering" section on the right represents the skills to operate databases and implement them as IT tools. Meanwhile, the "Business Ability" section at the top represents knowledge of the industry or business sector, and the ability to organize and solve business problems.
If you want to become a professional known as a data scientist, you will need a fairly wide range of knowledge and skills, but in reality, this will often be done in collaboration with a team.
The person in charge of promoting data utilization within the company will work together with data scientists and engineers to solve problems. In doing so, the most important skill and preparation that a person in charge of data utilization should have is business ability, i.e. the ability to define business problems.
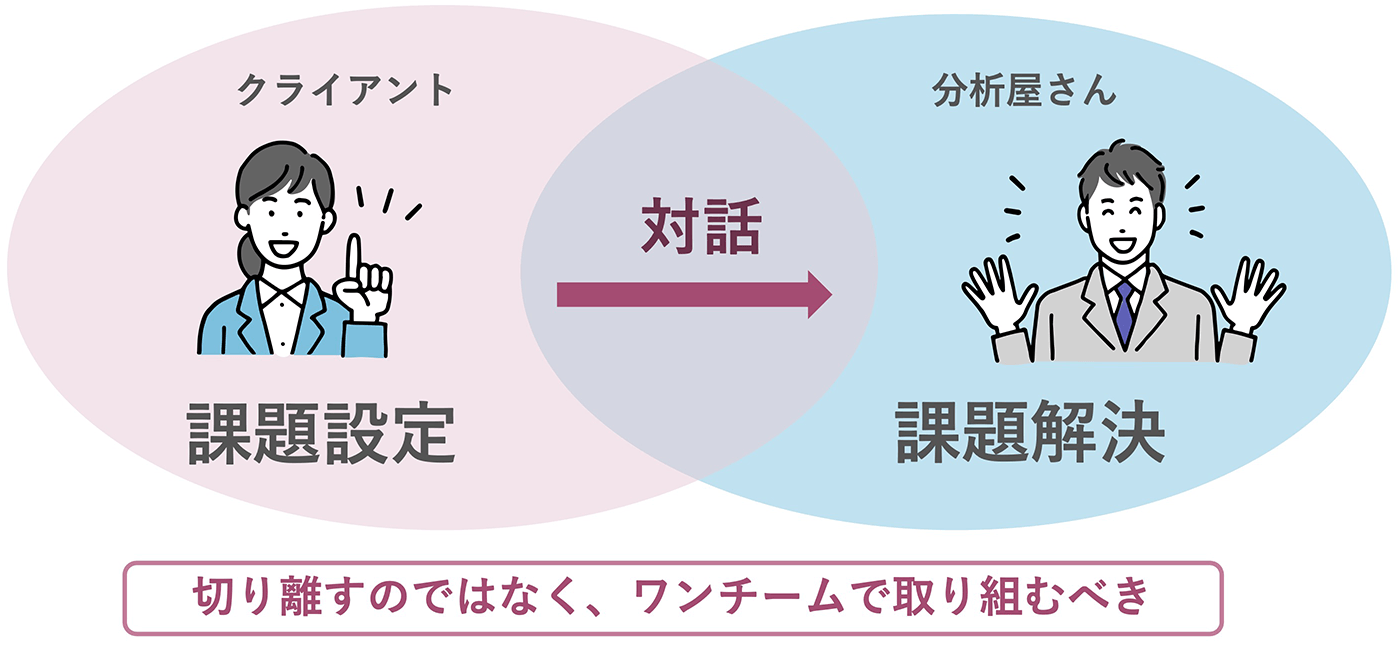
Data scientists and engineers are skilled at solving set problems, but it's important to remember that it's ultimately the client themselves who sets the problem to be solved. (Sometimes we set the problem together, but often the client has a good hypothesis.)
If there is a discrepancy in perception here,
Analyst: "I understand! Now, please organize your business issues and tell us the KPIs you want to improve! And the data you need!"
Client: "If I had known that, I wouldn't have consulted you..."
This is the kind of interaction that occurs. The diagram of skill sets in the three main fields shows that data analysis requires a wide range of skills and knowledge, but it is extremely difficult to acquire all the necessary abilities. This is why it is important for clients and analysts to engage in repeated dialogue from problem definition to problem resolution. It can be said that data analysis is only possible when each party works as a team, rather than separating their respective roles. Since data analysis is often carried out through team collaboration, rather than trying to acquire all the skills, it is best to start by honing your ability to define core business issues. Failure to do this properly will not only hinder communication with engineers, but will also often result in analysis that is meaningless.
3. Define your business objectives
Setting business challenges is the process of verbalizing a vague sense of the challenge in detail. The ultimate goal of verbalization is to translate it into numbers. In data analysis, challenges that have been translated into numbers are called "outcome variables."
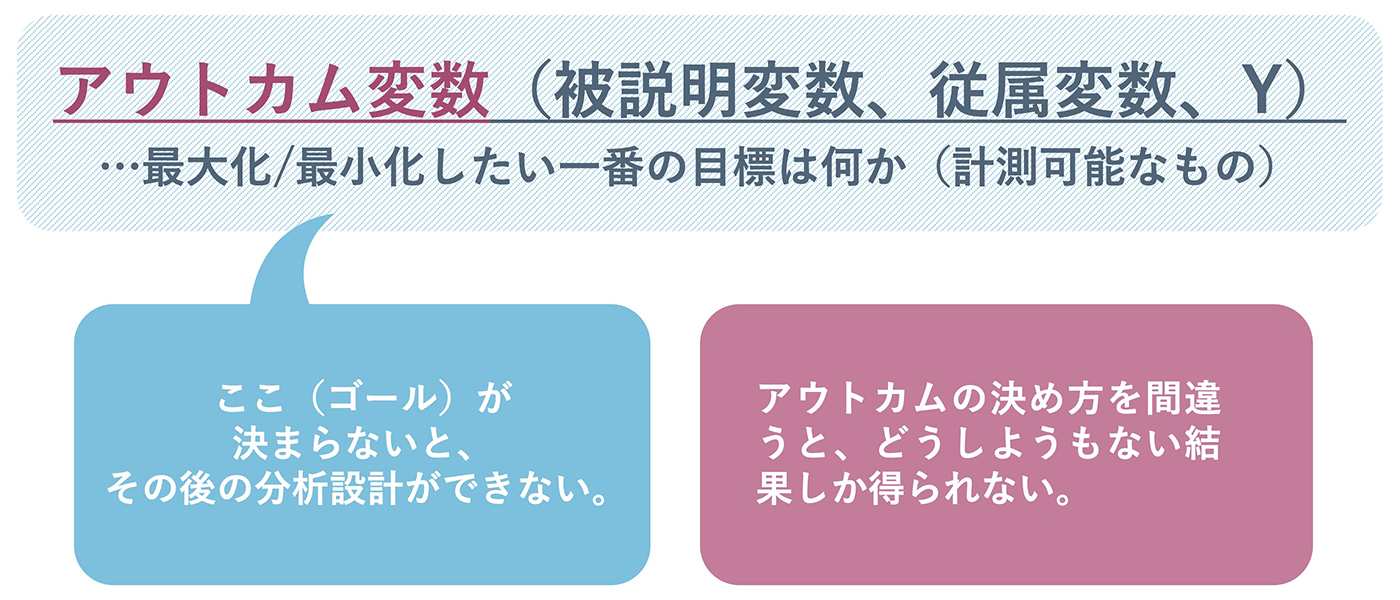
This is a bit of a difficult term, but simply put, it's about what is the primary goal (something measurable) you want to maximize/minimize. If you don't decide on this goal, you won't be able to design the subsequent analysis and will only get meaningless results, so be careful not to just decide on an outcome without thinking. An example of an incorrect outcome is something that is "statistically correct but worthless." For example, if you use the indicator "purchase amount per visit" as the outcome, you might get the analysis result that "we should focus on customers who buy in bulk during sales periods." However, when you think about it in real business terms, having customers visit the store only during sales periods when prices are discounted will not result in profits.
The key points for setting outcome variables will be discussed later, but remember that "setting business problems" is the process from having a vague sense of the problem to setting appropriate outcome variables.
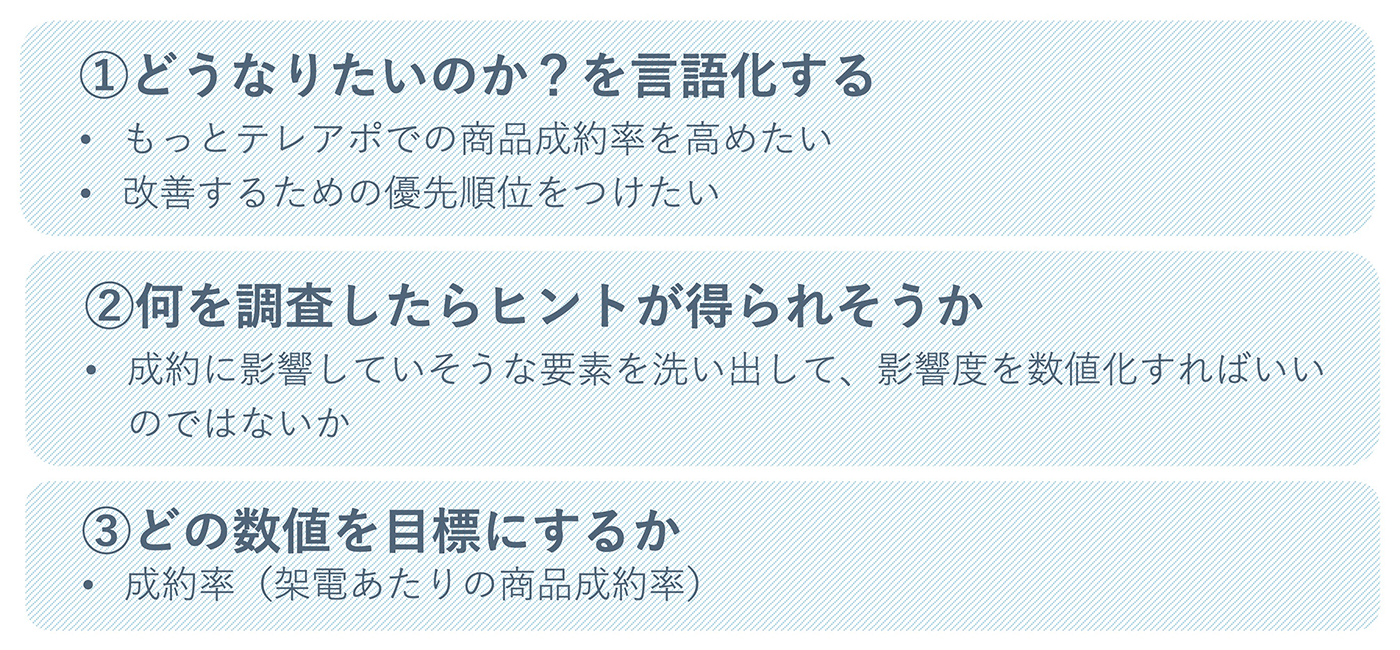
We will briefly explain how to set business challenges using an example. For example, let's say a B2C telephone appointment making company has a problem: "We want to increase our product conversion rate, but we don't know which of the following factors has the greatest impact on conversion rate: the time of day we make calls, the person making the calls, customer attributes, or scripts. We want to prioritize improvements." To set this as a business challenge for data analysis, we need to think about it in the following three steps.
- Put into words what you want to become
- What should I investigate to get some clues?
- What number should you aim for?
This order is the most important point when setting goals. However, the reality is that there are many companies that fail to address these three points. To set goals, try to start by carefully addressing these points. Let's apply this to the example of the telephone appointment-making company mentioned earlier.
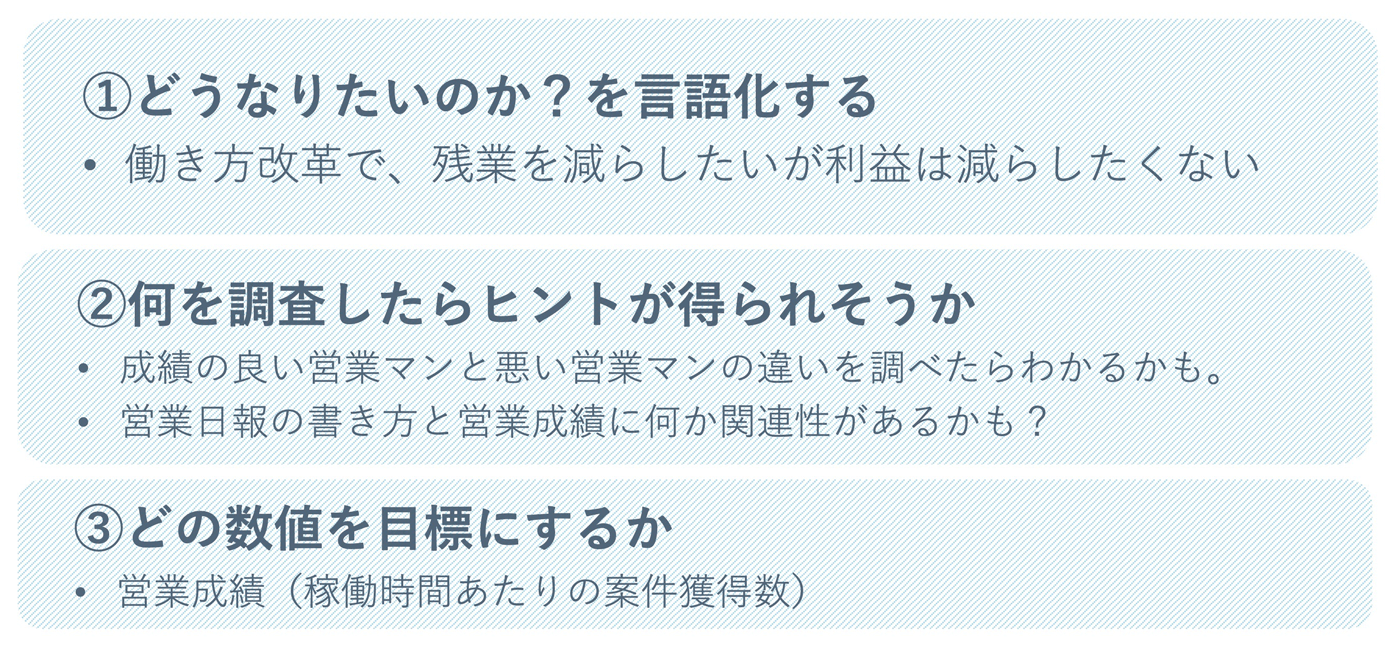
In this way, you can put your issues into words and organize them. Other examples of issues faced by companies working on work style reform include:
You can set goals like these. Once the goals are clear, the rest will be smooth sailing. However, some of you who have read this far may be thinking, "I understand, but I can't imagine how to set those three goals." In particular, "Putting into words what you want to achieve" is the first step in setting business goals, but at this stage, I often hear people say, "The problem is that I can't even find the goal." In my experience, many people don't really understand how to set goals or solve problems. But don't worry. As Pablo Picasso once said, "To know what you are trying to paint, you must begin to paint." It's important not to be too perfectionist, but to start with something that is easy to tackle and likely to be effective, and build up successful experiences. Doing so will make it easier to gain cooperation within the company later, so start small.
If you are unable to identify business issues, it would be a good idea to first analyze the following indicators to see if there are any areas for improvement.
・Churn rate
・Contract rate
・Return on advertising spend (ROAS)
These are marketing indicators that are easy to implement and likely to produce results. Conversely, using cost per click (CPC) or page views as indicators does not directly link to profits. Try to analyze things that have as much impact on profits as possible by first using them as outcome variables.
Also, please note that before immediately subjecting outcome variables to statistical analysis or handing them over to a data scientist, we recommend using features such as dashboards to visualize the data.
Numbers are difficult for humans to understand intuitively, so try converting them into something that is easier to understand intuitively, such as a graph, and looking at them.
At that time, if it is a time series graph, try to find the peaks and valleys. If you start to wonder, "Why are there so many cancellations only on this day and at this time of day?", that's your chance. There may be some points for improvement hidden there.
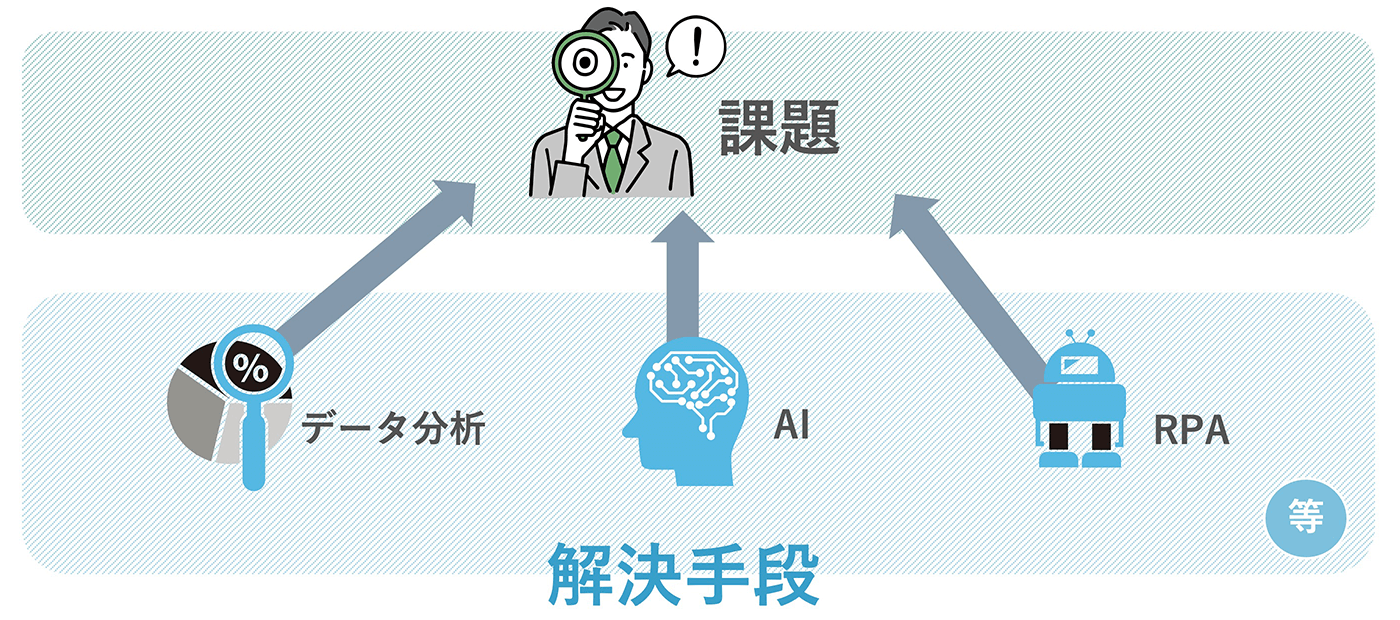
Also, project managers should keep in mind that business problems are not something that you decide on and continue to use forever; they need to be refined. Therefore, it's important to first become interested in the data and start looking at and tinkering with it. There's nothing wrong with making tentative decisions at first, so try starting small. In this lesson, we discuss the importance and methods of data analysis, but data analysis is not the only way to solve business problems. There are a wide variety of solutions to problems, including AI and RPA, so it's important to remember that it's important to flexibly choose and combine methods according to the problem you want to solve.
4. Data analysis flow
Finally, we will briefly introduce the process of data analysis after the business problem has been set.
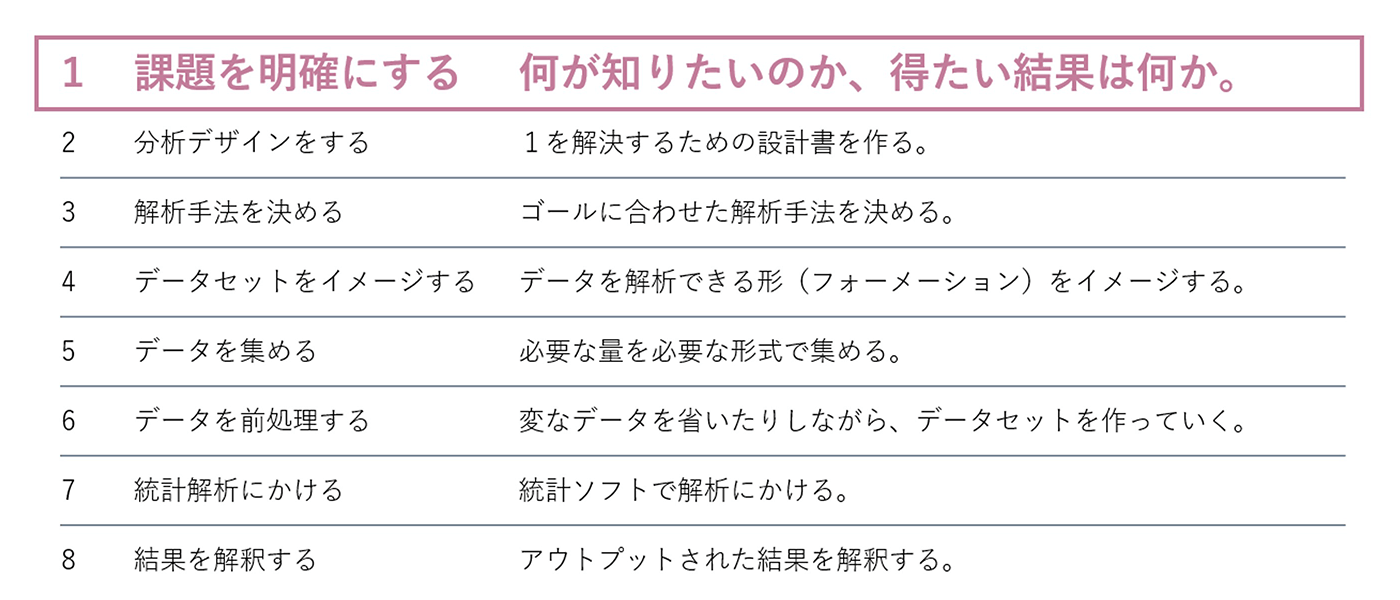
As mentioned above, the flow of data analysis can be broadly divided into eight stages. What we discussed in this lesson corresponds to "1. Clarify the problem." Once you have defined the problem, you need to create an analysis design, that is, a design document to solve that problem.
We offer video courses aimed at beginners to help them acquire the fundamental skills of statistics and data analysis. This service is designed to help you acquire data literacy and increase your own added value. If you're interested in continuing the course, please feel free to take the course. That's all for today's lesson. Thank you.
Related Content
-

The Use of Generative AI in Talent Management: From Intuition to Data-Driven Approaches
-

What is CDC (Change Data Capture)? – A method for securely and reliably transporting data from on-premises systems.
-

data integration techniques for character code conversion—preparing for a mix of SJIS, JEF, and Unicode.