New Developer Blog Series Vol. 3 - Data Visualization and Analysis

Vol.03 Is XX included in the analysis?② - Dimensions -
This is the third article on data visualization and analysis, and is a continuation of the previous article.
Last time we explained the points of measures, so this time we will explain dimensions in terms of points.
If you're wondering what measures and dimensions are, please reread the previous article.
Only the most important points are repeated below.
- Dimensions are qualitative information that serve as analytical angles.
- Measures are quantitative information that serve as indicators in analysis.
- When analyzing, rather than just vaguely looking at the overall picture, we cut measures into dimensions.
Dimensional mistakes
The most obvious mistakes with dimensions are:
You are conducting an analysis on a certain metric.
When we looked at the department dimension, we found that there seemed to be a problem in Data Engineering Division 2.
So I will inform Mr./Ms. XX from Data Engineering Division 2 of this fact.
He replied coldly, "I know that," and seemed to be in a bad mood.

This becomes clear when you replace a certain indicator with "sales" or "average overtime hours."
As mentioned in the dialogue, the example above simply conveys a fact that anyone managing that department would already know (unless a very new measure is being analyzed).
So maybe he took it as a sarcastic remark and upset her.
This is unlikely to actually happen in the field.
This is because even the person doing the analysis will realize that this is not possible.
However, I think there have been many times when I have come across results like this and have had to quietly close the device.
The main thing I wanted to convey here is
Simply cutting out numbers based on easy-to-understand dimensions will lack analytical sharpness.
That is what it means.
Are bins included in the analysis?
So what should we do?
This time I'll give you the answer first.
The approach to take here is to create qualitative information from quantitative information.
That is, create dimensions from measures.
What this means is that we split up and group measures.
For example, people who score 81 to 100 points on a test would be placed in Group A, which is creating qualitative information from quantitative information.
These groups are called bins, and the process of dividing them into bins is called binning.
(Also called binning or bin division)

In the soccer World Cup draw, teams are divided into pots based on their FIFA rankings.
The FIFA rankings are divided into groups of eight countries from the top down, and then into Pots 1 to 4.
This is also binning.
This series has been about putting the obvious into words, and binning is a concept that has already been adopted as a matter of course.
I am currently revising this article on an ANA flight on my way back from attending AWS re:Invent.
ANA Premium members are also divided into statuses such as bronze and silver depending on the number of points they have.
Although it is not the starting point of the analysis, this also constitutes binning.
In CRM, the analysis generally revolves around membership ranks binned according to the number of purchases and the amount of purchases.
Well-known analytical techniques such as RFM analysis, cohort analysis, and decile analysis all utilize binning.
※Sometimes I use it as it is.
If you notice that your analysis does not include bins, try adding a binned dimension to your analysis axes.
Taking our company as an example, if we were only analyzing by product identification code or profit center code, we would try to run an analysis using bins binned by project size, team size, etc.
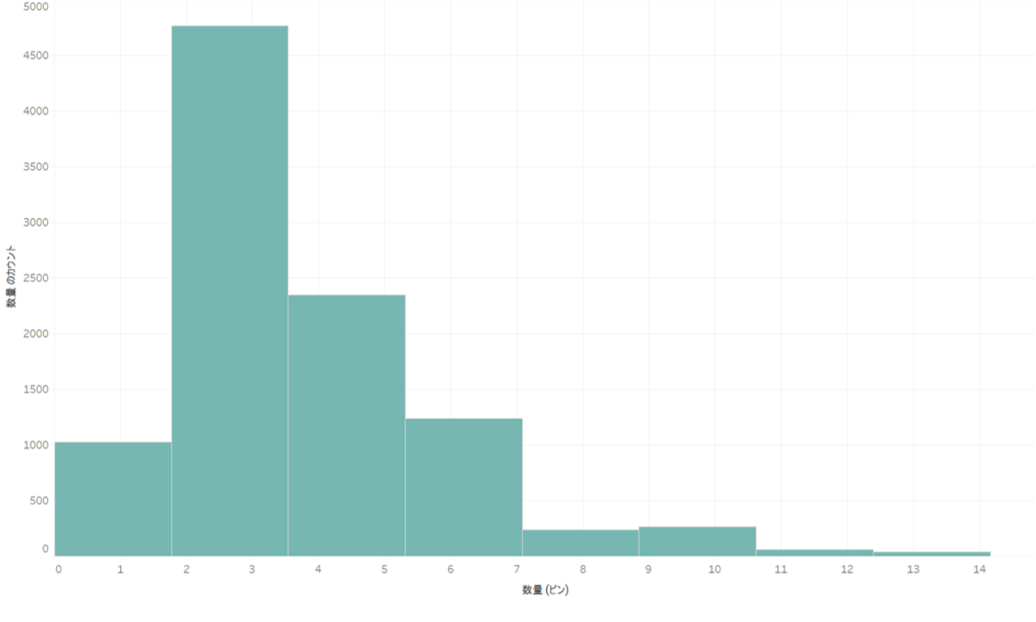
When you research bins, histograms always come up.
A histogram is just binning, so first check the distribution in a histogram to see if it is appropriate as a dimension.
For example, I mentioned earlier that people who scored between 81 and 100 points were placed in Group A, but if 90% of the total were in this group, the analysis would not be valid.
The order is to divide the data into bins that seem to have some meaning in the histogram, and then use them as dimensions.
How to use bottles
My recommendation is to choose either the bin or the measure from the SoR domain data, and the other from the SoE domain data.
It could be said that mixing both SoR and SoE data into a single analysis has already taken the first step, but perhaps it could be thought of as going one step further.

Here's an example:
- The size of transactions with customers is extracted from the SoR area and binned.
The image is up to 30 million, 30.01 million to 50 million, etc. - Extract the NPS survey results data from the SoE area and use it as a measure.
For example, the ~30 million bin will have a better NPS score than the 30.01 million to 50 million bin.
This will allow us to start discussions such as, "Perhaps our activities are not leading to satisfaction among those with larger trading volumes?"
Furthermore, if we replace the SoE side with SFA, the measures to be analyzed would be the number of days a sales opportunity remains in the pipeline and the number of sales negotiations.
Issues such as "Why do transactions with large volumes have longer retention periods?" are likely to arise.
I think the opposite pattern would also be fine.
For example, you may be able to see sales efficiency by binning by the number of sales meetings and looking at the size of the transactions and the growth rate from the previous year.
You can imagine that if you then slice the data by dimensions such as sales representative, trends will become even easier to see.
Salespeople fall into the category of "easy-to-understand dimensions" mentioned at the beginning,
Easy-to-understand dimensions are not necessarily bad, but it is important to combine them.
Binning in Feature Engineering
Binning is also used in feature engineering, which is closely related to machine learning. It is used to bin continuous values to generate new categorical features, with the main purposes being smoothing (removing noise) and improving the expressiveness of linear models.
Having written this much, I will refrain from going into detail about feature engineering.
(There is also the possibility that many people will drop out, and in my experience, it is difficult to dig deep into the topic.)
However, there is a reason why I have mentioned it here.
As I alluded to briefly at the end of my previous article, if you think deeply about the methodology of visualization and analysis,
At some point you will come across a methodology related to machine learning.
I intentionally didn’t use simple expressions, but the expression I wrote a few lines ago, “binning continuous values to generate new categorical features,” actually means almost the same thing as “splitting and grouping measures to create dimensions.”
The current state of data engineering is subdivided into areas such as visualization, analysis, and machine learning, and each player has a different area of expertise, but I think it's important to be aware that these are actually connected, continuous, and inseparable.
(It goes without saying that they are connected because statistics is the foundation.)
Future articles
In the three articles so far, we have explained the basic concepts of data analysis and visualization.
- Two times ago Here are some points about data visualization:
Aim for visualization that allows you to immediately see whether the situation requires attention, whether the numbers are good or bad, and what actions are required. - last time are major points that can be stumbling blocks
Use division to convert and eliminate implicit assumptions to make it easier to compare. - And this time, we will look at some common stumbling points from a dimension perspective.
Analysis based on easy-to-understand dimensions alone lacks sharpness, so create dimensions
I have tried to write the content in a way that both analysts and engineers can understand.
From next time onwards, I'd like to change things up a bit and talk about something a bit more engineering-related.
That said, I won't be jumping straight into technical discussions about Spark clusters or DataFrames.
What is data and what is quality? Data engineering requires a slightly different perspective than before.
I hope to be able to share such stories with you.
Until next time, I look forward to seeing you.
The person who wrote the article