Developer Blog Series Vol. 5 - Data Visualization and Analysis


Vol.05 AWS re:Invent from an Analytics Perspective (2023 Edition)
Read the 2022 AWS re:Invent article here
This is the fifth article on data analysis and visualization.
We attended AWS re:Invent in Las Vegas from November 27th to December 1st, 2023.
First of all, I would like to point out that this is not a summary of the updates that have been announced.
That's not what I'm being asked to do, so I'd like to report from the perspective of a data engineer.
Re-understanding how ETL is used
Before we get into the content, here's a little recap.
Have you heard of Data Preparation recently?
I remember hearing about Tableau Prep a lot when it first came out, but I haven't heard about it as much recently.
However, this definition has not become outdated and is still in use.
Data preparation is one way ETL is used.
ETL can refer to a process or a tool, but talking about it solely in terms of ETL can be too coarse-grained.
So, let's review how ETL is used in data analysis platforms.
*We will leave aside the issue of data integration platform for now, as it is self-evident.
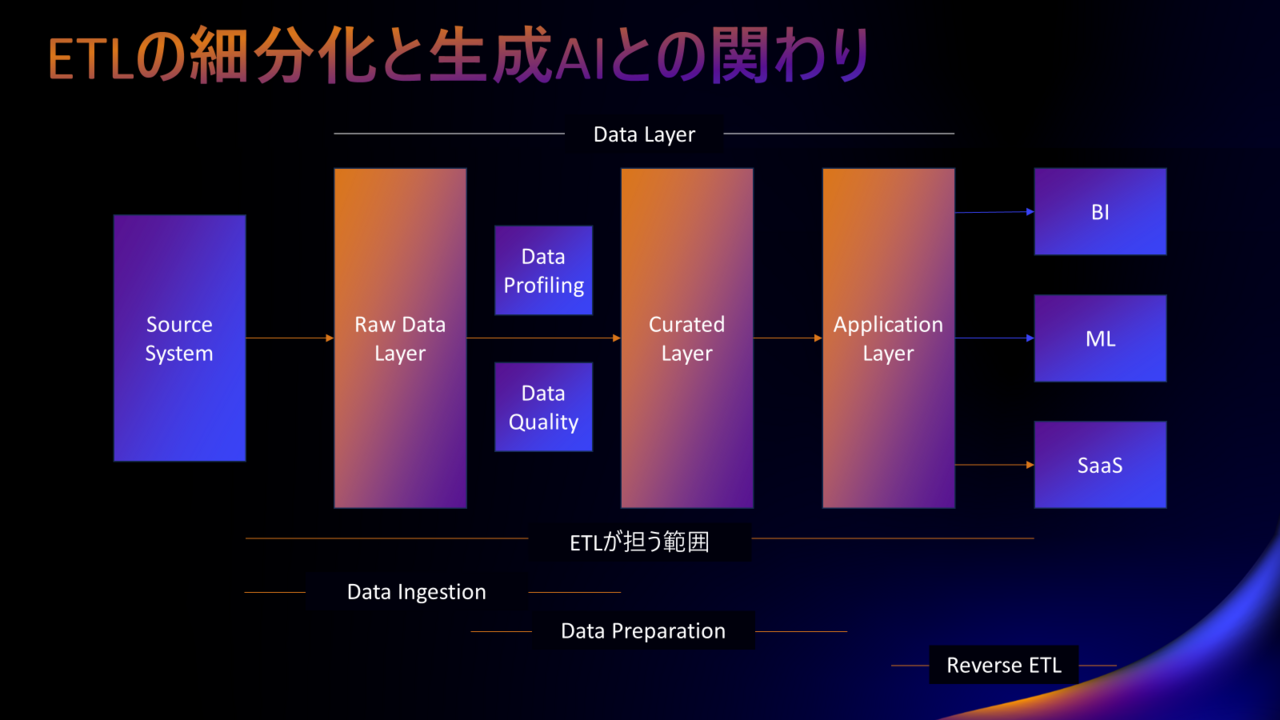
The usage can be broadly divided into the following:
- Data Ingestion | Data ingestion (into DWH, etc.)
- Data Preparation | Editing and processing data → Creating data marts, etc.
- Reverse ETL | Return data from the analysis platform to SaaS, mission-critical system, core system, etc.
If you don't make it clear what you're talking about, misunderstandings may arise.
For example, reactions to zero-ETL, which was announced at re:Invent last year, were very mixed.
As for me, I was impressed by the strength of the message, but I wasn't surprised by the content.
As I wrote in the article of the same name after re:Invent in 2022, the "zero" in zero-ETL refers only to data ingestion.
This remains true as of the time of writing this article.
The decline in ETL use for data ingestion has been a given since before last year's re:Invent.
So I wasn't surprised, but it would be surprising if you thought that the zero would affect the whole thing.
I hope you now understand that ETL can be broadly divided into Data Ingestion, Data Preparation, and Reverse ETL.
For example, if you look at AWS announcements related to ETL, you will basically be following updates to Glue.
However, this makes it difficult to see the big picture, as Data Preparation is implemented in a separate service from Glue.
When building a data utilization infrastructure using AWS, you basically combine multiple services.
I think it would be best to follow the conceptual model and the role that each service plays within the architecture.
Of course, some people prefer to follow updates for individual services. It depends on your role.
In my opinion, for data engineers, it's better to look at the big picture rather than just following service updates.
This time, I would like to look at this from the perspective of Data Ingestion and Data Preparation.
Data Ingestion
First, I will write about Data Ingestion.
What is Data Ingestion? In most cases, it refers to putting data directly into a DWH.
*This may not be a DWH, so accuracy is not emphasized.
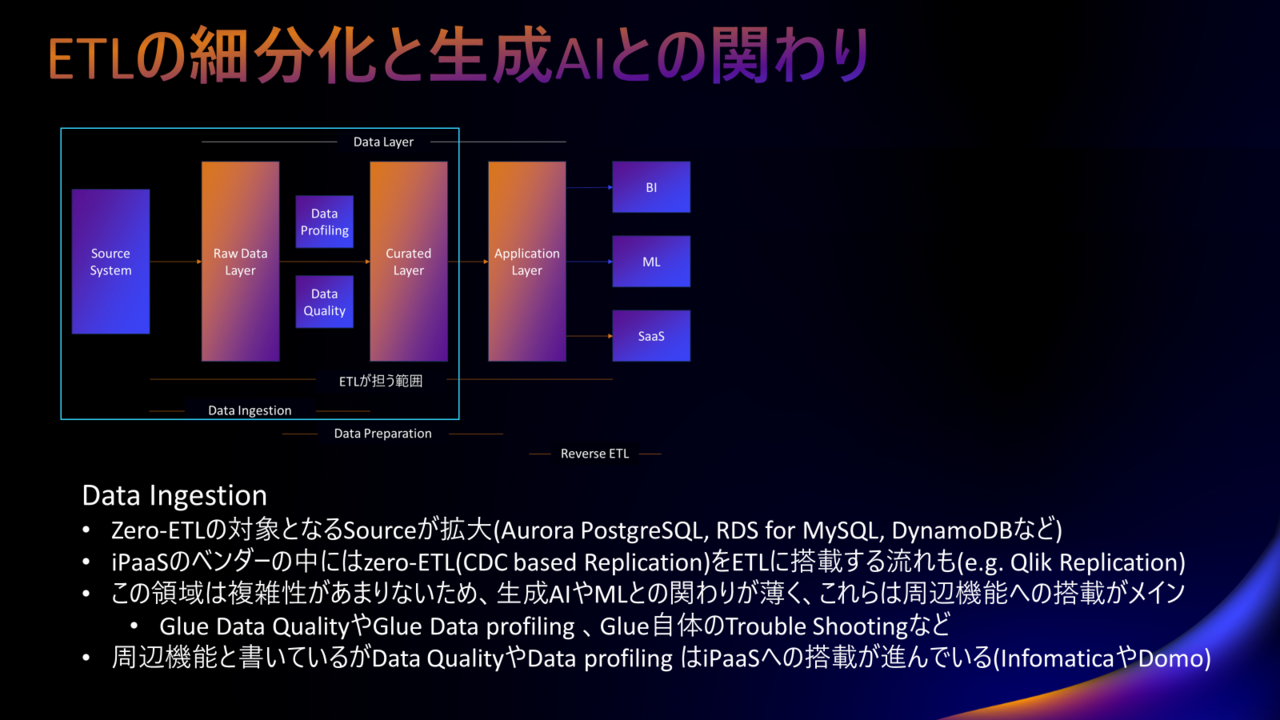
I wrote that Data Ingestion is an area that zero-ETL targets.
Zero-ETL is replication using CDC (Change Data Capture).
To put it more simply, it is a system that detects changes to the original data and synchronizes it.
Data as is DWH Just put it in ETL I think you can imagine that it would be fine if it wasn't there.
*The reality is different, but I will leave that out for now.
This is no different from what has been done for a long time using SQL Loader or the BCP utility.
And here's a simple thing to do, Generation AI There isn't much connection with it.
However, after Data Ingestion, the data must be checked for content and quality.
Even if the data import is successful, whether it is usable/safe to use is another matter.
There are systems called Data Profiling and Data Quality that handle these tasks, and these are available as services not only on AWS.
To help you understand better, we will show you an example of how each mechanism achieves its purpose.
- Data Profiling checks your data and tells you if a column contains personal information.
- Data Quality checks whether the data distribution is within a pre-specified threshold range and detects anomalies.
Those with a keen sense of intuition may have noticed that this is an area that is very compatible with AI and ML (regardless of whether it is generative AI or not).
While ETL is losing its presence in data ingestion, related functions such as data profiling and data quality are increasingly being incorporated into iPaaS.
Also, (although this sounds strange in Japanese) zero-ETL is being incorporated into ETL.
In other words, ETL (or rather iPaaS) that can utilize replication using CDC is now available.
Will ETL in Data Ingestion include features such as Data Profiling, Data Quality, and zero-ETL?
And if it is implemented, will it be able to utilize AI and ML to contribute to improving the productivity of data engineers and data stewards?
This seems to be the key point.
(I don't think adding features is the right answer.)
Data Preparation
Next is Data Preparation.
This includes tasks such as creating data marts, creating BI semantic models, and generating ML feature sets.
I think the level of understanding of this field will differ greatly between data engineers and others, so I will start with some additional information.
The first action a data engineer takes in data preparation is to review the source data.
*In some cases, we start by searching for data.
Specifically, we look at the cardinality and distribution of the data.
Check what types of records exist in the data and how they are distributed.
In the process, we also use data catalogs.
The idea is that instead of opening the ETL editor, you first check the source data in detail using SQL.
With that in mind, what is AWS trying to do with Data Preparation?
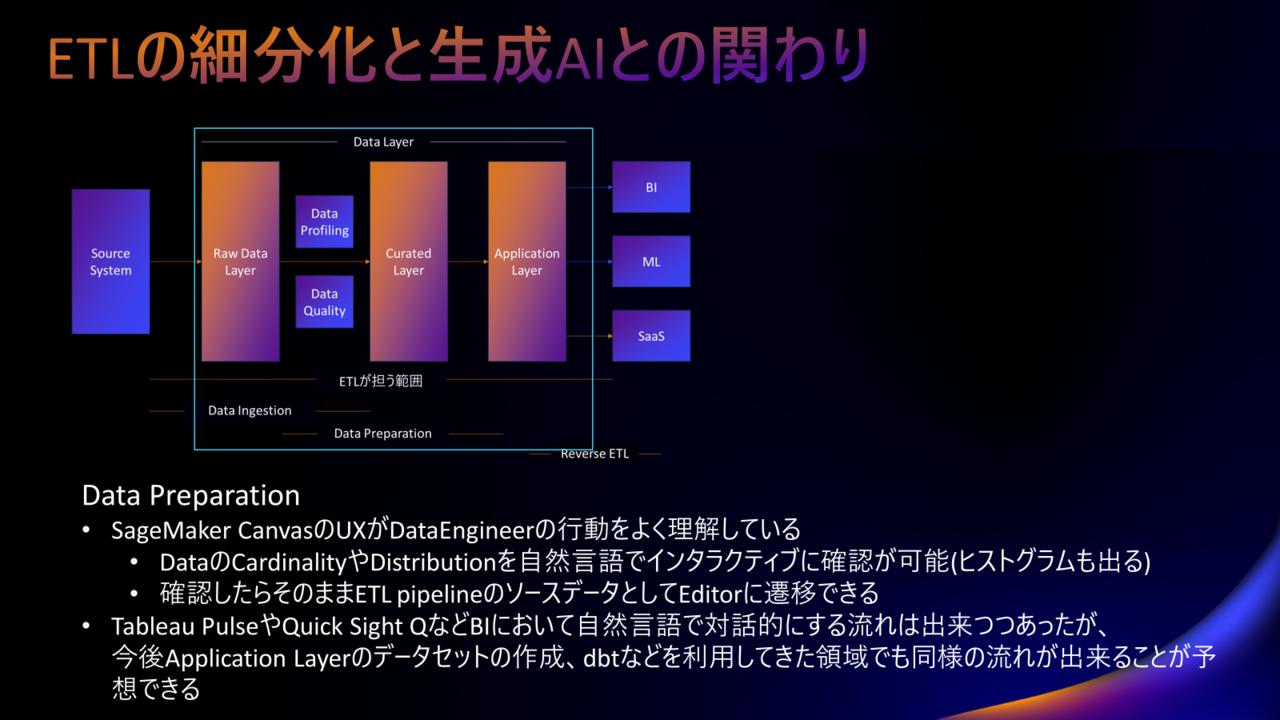
This is easy to understand by looking at SageMaker Canvas.
SageMaker Canvas lets you explore the cardinality and distribution of your data in natural language.
Data engineers carry out this check by first checking the date column, then the classification column, and so on, changing the conditions in detail. This type of check is most efficient when it can be done interactively, so it is an area that is most compatible with generative AI.
The results can be easily visualized in the form of a histogram.
Once you have confirmed this, you can move on to the ETL editor using that data as the source.
It's really seamless and really understands the workflow of a data engineer.
For example, many services have features that allow for simple interactive visualization, such as Tableau Pulse.
Interactive visualization of BI is often useful, so this is a legitimate evolution, but this is the first time I've seen attention being paid to simple visualization in the preparatory stage of data processing.
In the future, it is expected that evolution in this direction will continue not only in the BI field but also in the dbt field.
In terms of how to use generative AI in data preparation, my impression is that checking data cardinality and distribution in natural language is the most useful one I've heard of so far.
The gap created by the data talent shortage
This is a bit of a change of topic, but I'd like to talk about the gaps I noticed after attending several sessions.
The diagram below is an example of architecture for realizing a data analysis platform.
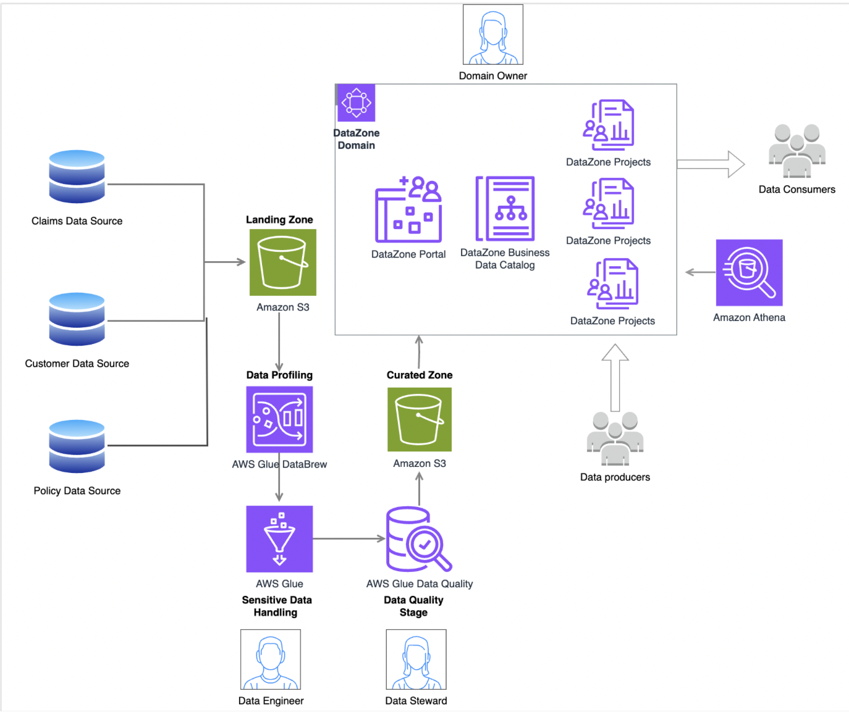
At the bottom, you will see the Data Quality section that I mentioned earlier.
Data Quality is an expression that implies that data stewards are responsible for ensuring it.
However, in Japan, there is an overwhelming shortage of data stewards compared to the demand.
Even if suitable data stewards are assigned in Japan, they are so busy exploring the data that they do not have time to check the data quality.
Additionally, the part shown as Data Zone in the diagram functions as a mechanism for realizing the data mesh.
Here we will introduce people called Data Producers, and in data mesh, Data Producers are assumed to be in business divisions.
Here too, it is extremely difficult for business divisions in Japan to assign someone to the role of Data Producer.
I'll leave the details aside and just want you to understand that it is not possible to build an organizational structure in Japan that takes into account the architecture presented by AWS.
The architecture shown in this diagram can be easily implemented in Japan.
However, there is an overwhelming lack of human resources and systems to make this architecture function to its full potential.
On the other hand, if the problem is a lack of power, it is possible that empowering generative AI could change the situation.
I mentioned earlier that Data Quality and Data Profiing are areas that go well with AI and ML.
I felt that there was a great possibility that we could go one step further and move towards a system where this could be operated more or less automatically.
summary
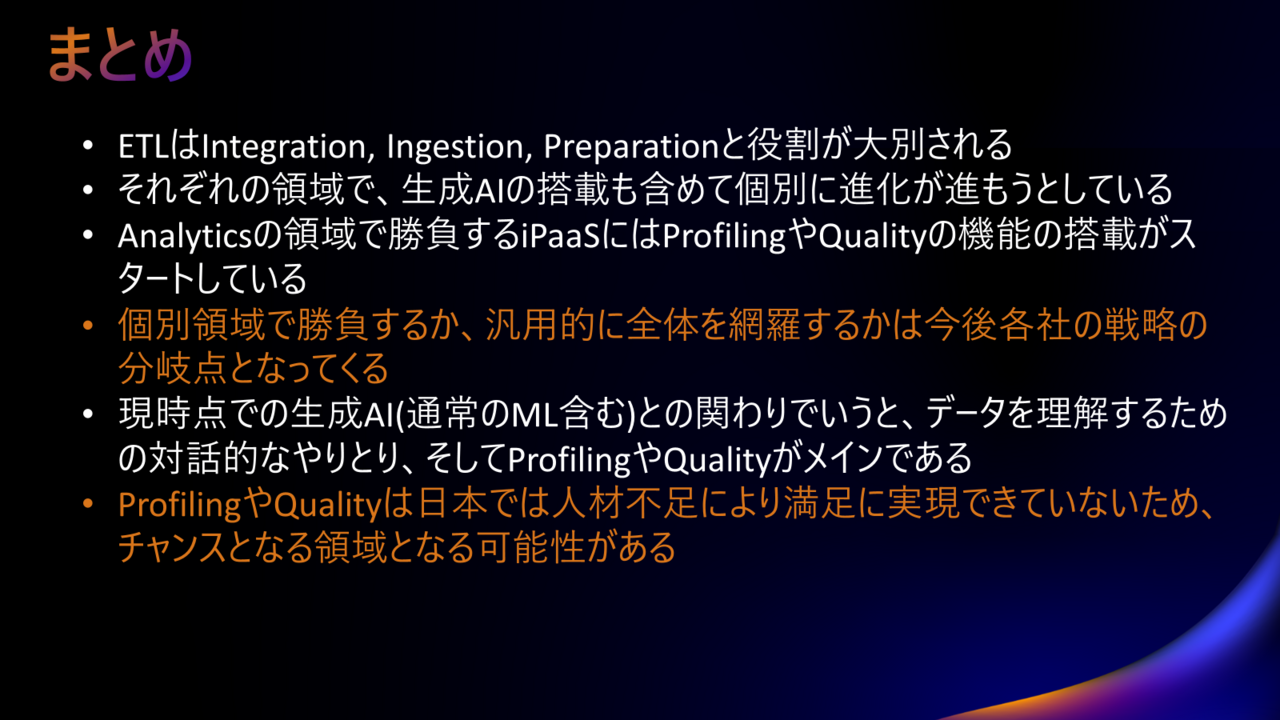
Everything I wanted to write is included in the image, so please refer to the image above.
Data Ingestion and Data Preparation have evolved in their respective specialized fields.
It would be good to follow this, but I also think that one direction would be to make it usable for general use rather than for exclusive use.
This is not the kind of content that allows us to conclude which direction we should go.
In any case, I wrote this report because I believe it is a good idea to have a basic understanding of the direction the world, including AWS, is heading in.
Looking at the big picture at this year's re:Invent, there were no surprising announcements.
It could also be said that many of the announcements were rather predictable and in line with what could be expected.
But that's not a negative thing; it also means that with the advent of generative AI, the direction the world is heading has been decided and it is definitely moving in that direction.
I realized this at re:Invent.
That's all, thank you for reading to the end.
The person who wrote the article