Developer Blog Series Vol. 10 - Data Visualization and Analysis


Vol.10Understanding the words and concepts surrounding data
This is the 10th article on data analysis and visualization.
This time, I will write about the prerequisite knowledge for tracking trends surrounding data.
So this explanation is not meant to be aimed at people with detailed knowledge, but it ended up being a long text that doesn't seem like it.
I'm aware that this is a selective read, but there's no harm in reading it...
"Separation of compute and storage" and standardization of data formats
An important concept for handling data is "separation of compute and storage."
First, let me explain the architecture.
Over the past decade or so, the performance of processing large-scale data has improved dramatically, and there are several reasons for this.
- Improving I/O performance through data compression technology and distributed placement
- Improved network performance by integrating distributed data
- Distributed processing to eliminate CPU bottlenecks instead of I/O
In distributed processing, it is important to determine how to divide the data and pass it to each computing cluster.
This is a complex problem because we are not dealing with a single piece of data, but rather data joining and so on.
So, distributed storage efficiency (read efficiency) and processing efficiency are completely different things.
If data is stored in 60 regions, it would be inconvenient if the computing cluster were also fixed to 60 nodes.
This separates the storage area from the computing cluster.
This separation allows you to scale storage and compute independently.
There is no need to keep computing resources running at all times to persist data.
This is where Snowflake and Big Query had a clear advantage over Redshift and Synapse at their inception.
Benefits from a business perspective
Separation of compute and storage is important not only from an architectural standpoint, but also from a business perspective.
In the real world, data held is a shared asset for the entire company, but what about resources for data analysis?
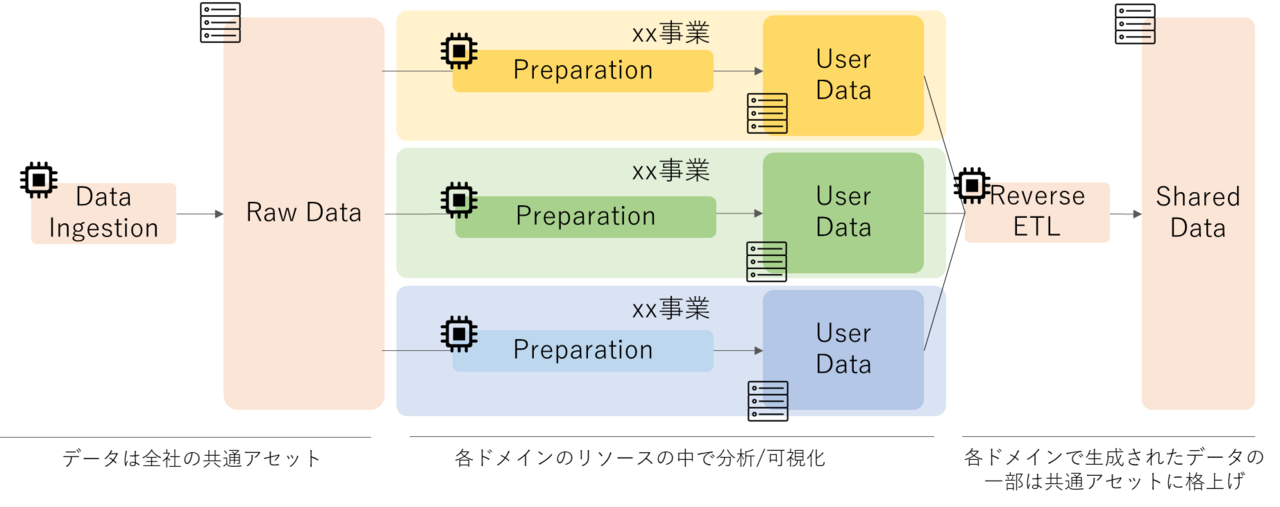
It is reasonable to say that the processing costs required to conduct analysis in a business domain should be borne by that business domain (what is correct will vary depending on the level of maturity).
If we were to achieve this, we would need to separate compute and storage.
This makes it possible to design a system where storage costs are a company-wide cost and compute costs are a cost for each business domain.
Benefits for analysts (developers)
There are other things that become possible by separating compute and storage.
That is, using multiple engines for the same data.
For example, Treasure Data's Plazma DB, a CDP, allows you to choose the query engine (Hive or Presto) when issuing a query for the same data.
Some of you may understand how amazing it is if I explain it as "it allows you to choose whether to use ORACLE or SQL Server as the engine when issuing a query."
The reason for using different engines is that they have different areas of expertise (ad hoc and batch), which gives analysts more options.
This was made possible by the separation of compute and storage, and the resulting standardization of data formats.
Open Table Formats and the Evolution of Data Lakes
There are several efforts underway to standardize this data format in the form of Open Table Formats.
The three most prominent examples are the following, all of which are open source projects:
- Delta Lake (developed by Databricks)
- Apache Iceberg (developed by Netflix)
- Apache Hudi (developed by Uber)
As part of my explanation, I started by talking about standardizing data formats, which have ACID properties that are not found in traditional Data Lakes.
Due to this feature, the roles previously played by DWHs can now be fulfilled by Data Lake alone (no DWH is needed), which is why it is called Lakehouse or Transactional Data Lake.
I think the correct understanding is that the storage layer of the DWH has been separated and made into an open specification.
You will definitely see the term Lakehouse and the concept of expanding your Data Lake in the future.
Semantic Layer
Next, we will explain the semantic layer.
The semantic layer is a layer for implementing a semantic data model.
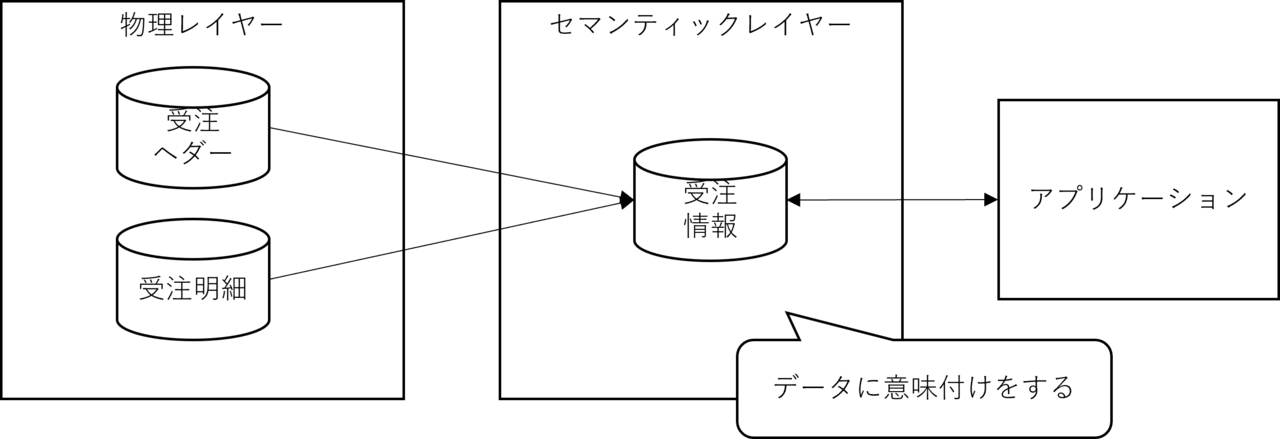
Essentially, the idea is to create a logical layer between the physical location of the data and the application to give meaning to the data, and this has been widely used since the days when relational databases were the only available method.
For example, when order information is normalized to third normal form, it is typically separated into an order header and order details table structure.
A common implementation that has been seen for a long time is to prepare a view (order view) that combines these in advance and give meaning to the order information.
In this case, VIEW also becomes a semantic layer in a broad sense.
The main purpose of the semantic layer is to give meaning to data, as the name suggests, but it also has secondary benefits.
The advantage is that the source data and the application are loosely coupled, making them more resilient to change.
In reality, this is more of a benefit of having a logical layer than a semantic layer.
Remember, it's good to have a logical layer between your source data and your application.
BI is particularly useful from this perspective, as input data replacement occurs on a daily basis.
Many BI products, such as Tableau, are equipped with features that enable a semantic layer.
Yes, this functionality is implemented in BI products.
Although we have gone to great lengths to loosely couple the source data and the application, in reality it is tightly coupled with the application product.
If you switch BI products, the entire semantic layer will have to be recreated.
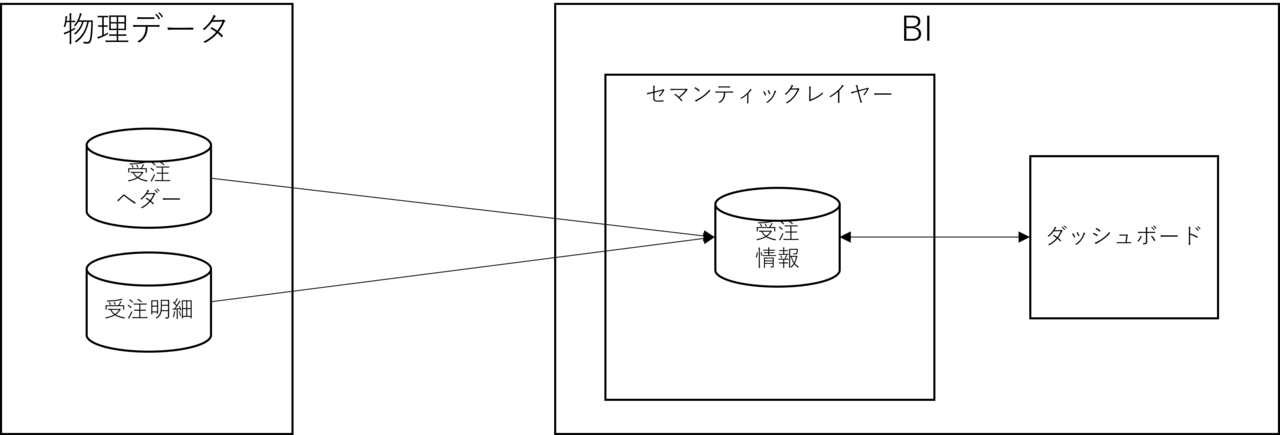
To resolve this tight coupling, it is necessary to move the semantic layer (logical layer) outside the BI framework.
*In other words, it returns to the state of the previous image.
To make it even more sparse, we can also include storage separation, which gives us the following picture:
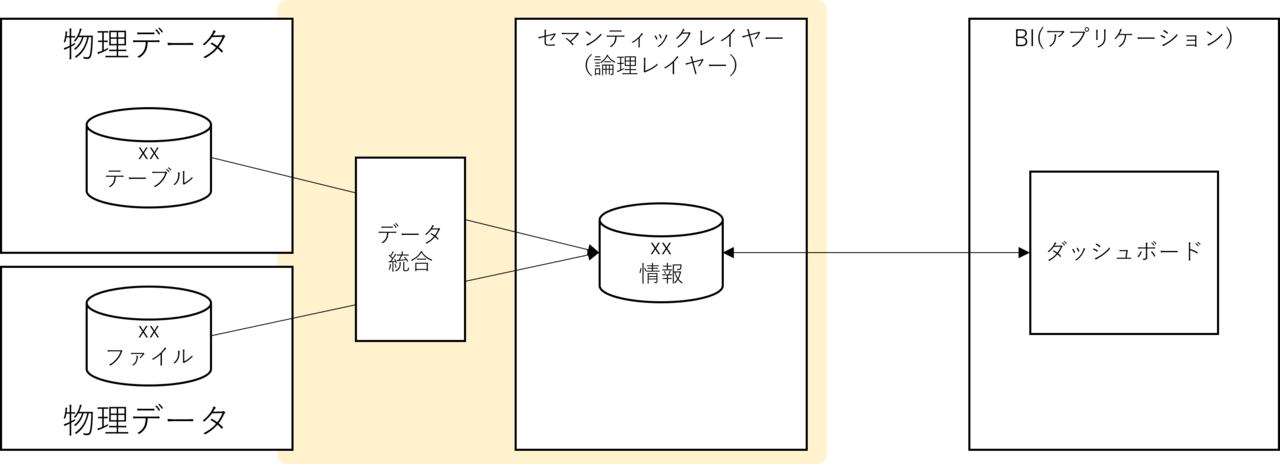
And the products/services that make the yellow part of this picture a reality already exist.
That's what data virtualization services and products are.
Are Data Virtualization Products/Services Really Great?
There are people in the world who loudly proclaim, "We don't need ETL!", and one of them is the data virtualization crowd.
Data virtualization products and services claim to achieve this logical layer without physically holding the data.
If you have read this article up to this point, you probably understand the benefits of logical layers.
On the other hand, some people may feel uncomfortable with the idea of realizing a logical layer without having physical data.
Many people have experienced performance issues due to excessive use of VIEWs in RDBs.
This is always a problem with disembodied data.
Furthermore, in the case of data virtualization, since data crosses networks, the load on the network must also be taken into consideration.
Can you accommodate entry/exit requirements?
Can data quality be guaranteed without the ability to assign metadata, including lineage?
The biggest problem is having a single source of truth (SSOT).
From the perspective of data analysis, this is achieved through an ecosystem that includes DWH and the surrounding ETL.
Let's look at it with a premise
The most neutral definition of Data Fabric mentioned at the beginning is the Gartner definition.
Gartner's definition states that data virtualization is important in Data Fabric.
The data virtualization mentioned here is a concept; essentially, it means creating a semantic layer and making full use of metadata to improve the completeness of the semantic model.
The data virtualization crowd has changed the tone of this to explain that this would not be possible without data virtualization products/services.
It is important to give meaning to data at a semantic layer and to loosely couple source data with applications.
However, this does not inherently matter whether or not physical data is used to realize the logical layer.
What is loosely coupled is the source data and the application, and in most cases the semantic layer functions of BI tools also retain the data as an entity.
Physically storing data in the logical layer is very similar to creating a data mart.
In many cases, a data mart implementation may be sufficient.
I wrote this article because I believe that understanding the context is necessary to see the essence of the words and concepts surrounding data.
As usual, this article is long, but I hope it will be useful to someone.
Thank you for reading to the end.
The person who wrote the article