

ETL(Extract/Transform/Load)
「ETL(Extract/Transform/Load)」
This glossary explains various keywords that will help you understand the mindset necessary for data utilization and successful DX.
This time, we will explain the "connecting" technology, which is actually often an important element in realizing data utilization, and one type of it, "ETL," and consider what you should keep in mind to successfully utilize data.
What is ETL?
ETL stands for "Extract/Transform/Load." It refers to the entire process of extracting data from various data sources such as IT systems and clouds, performing necessary data transformations, and loading the data into other systems. The software tools that perform this process are called "ETL tools" or simply "ETL."
When it comes to utilizing data, the focus tends to be on data analysis and visualization tools. Furthermore, the need for a data infrastructure is often considered a given. However, in practice, a significant amount of effort is often spent on "data integration"—the stage of collecting data. ETL (Extract, Transform, Load) is a method developed to efficiently alleviate these challenges.
For more information on ETL-related keywords such as "EAI" and "iPaaS (Integration Platform as a Service)," please see here.
⇒ EAI|Glossary
⇒ iPaaS | Glossary
When you decide to "start using data," these kinds of troublesome things are likely to happen in reality.
Recently, more and more companies are trying to utilize data in their businesses. However, it's not uncommon for them to fail to achieve sufficient results despite their efforts.
What kind of image comes to mind when you hear the phrase "engaging in data utilization"? Do you imagine a data scientist performing complex analyses to discover something from the data, or a person in charge of promoting data utilization within the company learning how to use BI tools, visualizing the data from various perspectives, and saying something like, "President, here's an opportunity!", leading to unprecedented results for the business?
However, what actually happens when you start working with data is often quite different from that impression. In reality, the majority of your work time is spent not on the analysis itself, but on the tedious and extensive tasks related to the data needed for the analysis. In fact, these difficult tasks are often the true reality of working with data.
So, let's think for a moment about what it actually means to "engage in utilizing data."
I'm thinking of taking action to utilize data.
Let's say, given the current trends, your company has decided that it needs to start using data more effectively. Up until now, you've only occasionally created analytical reports in Excel for monthly reporting, and haven't done anything more than that. Now, let's say the company has decided to adopt a more robust data utilization strategy.
The investigation will lead to the implementation of "BI tools" and "machine learning tools."
Now that we've been tasked with this, how should we begin? A common approach might involve researching data analysis tools and machine learning tools, as well as investigating case studies from other companies.
As a result, it's quite common for companies to decide to implement a "BI tool" that can aggregate and analyze data across various analytical axes and visualize it in an easy-to-understand way, and then begin to utilize that data.
I realized that "data is necessary" in order to "analyze with BI tools."
Let's say you've implemented a type of "BI tool" (self-service BI tool) that's easy for even less skilled users to use. When you first try it out using sample data, you'll find the tool convenient and easy to use, enabling you to perform data analysis.
With that in mind, when you try to start an analysis to produce results that will be useful in actual business, you realize that you can't do the analysis and won't get any results if you don't have the data to analyze in the first place. Before you can do data analysis, you need to "prepare the data" for it.
- Even if BI tools enable analytical work, in order to actually begin the analysis, "the necessary data must be available."
To engage in data analysis, it becomes clear that a "data infrastructure" capable of supplying the necessary data is essential.
The idea is that if you store the necessary data in a data warehouse (DWH), you should be able to perform analysis, but the workload becomes "too much" and it never gets done.
They realized that in order to advance data utilization, they first needed to establish a data infrastructure (they gained a better understanding of what was more important). They therefore decided to introduce a data infrastructure such as a DWH (data warehouse) and a data lake, which are databases that store data for analysis.
⇒ DWH|Glossary
⇒ Data Lake | Glossary
With the introduction of a data warehouse (DWH), we now have a data infrastructure within the company. We believe that by placing data in the DWH, we can utilize BI tools for data analysis and create easy-to-understand reports of the insights gained. Therefore, we begin by preparing the necessary data for analysis.
I realized that preparing the data needed for the analysis was taking more effort than I had anticipated.
I thought, "All that's left is to input the data." However, that task never ended. The necessary data was stored in various forms and locations throughout the company, requiring me to painstakingly track down, search for, and retrieve the data.
Furthermore, the data formats varied considerably. It couldn't be used directly for analysis, requiring a time-consuming conversion process.
Examples of data conversion work:
- Date data formats vary (Japanese and Western calendars, hyphen-separated and slash-separated dates, etc.)
- Mixing of full-width and half-width characters, mixing of Japanese character codes, and Japanese data in EBCDIC (a character code used on mainframes).
- As is, amount in millions of yen, comma separated, in dollars, in yen
- Address data with inconsistent notation rules
- The figures are compiled using different criteria, such as annual totals and fiscal year totals.
- The Excel file formats vary completely from creator to creator; deciphering mysterious macros.
- Discover what data is stored in which locations, machines, and clouds within the company
- Ensuring access and permissions to where data is stored
- Data that is unclear whether it is personal information that can be handled
- There are only paper documents, or scanned images of paper documents
- Customer numbers and product codes vary from branch to branch, and cannot be deciphered without inquiring.
When people hear about working on data utilization, they often imagine the process of analyzing the data itself. However, in reality, the time spent on the analysis process is only a small part of the total time required for data utilization.
In reality, a large portion of the time is often spent not on the analysis itself, but rather on the effort required to prepare the data necessary for the analysis.
Before even starting the data analysis itself, the reality of data utilization was that the majority of the work involved the arduous task of finding and collecting the necessary data, processing and pre-processing data with various file and data formats, organizing and storing it in a data warehouse, and preparing the data.
- Preparing "data that can be used for analysis" is often a time-consuming process.
- Data is scattered throughout the company in a variety of forms, making it time-consuming to find.
- Sometimes, preparing the data before starting the analysis can be time-consuming.
- Because the data formats vary, they may not be usable for analysis unless they are standardized.
- Sometimes, preprocessing is necessary, such as deleting data that cannot be used for analysis or filling in missing data items.
First of all, does the data I'm looking for even exist? And is this data up-to-date?
Furthermore, sometimes it's unclear whether such data even exists within the company, making it difficult to determine whether it can be found with time and effort or if the data simply doesn't exist. If the data doesn't exist, then it becomes necessary to create a data collection system from scratch, which also takes time.
Furthermore, you might start analyzing data you thought you'd found, only to be told later, "That data is from last year and is outdated."
- Sometimes, it's even unclear whether the necessary data for analysis exists within the company.
- Sometimes it's unclear whether something can be found if you spend enough time searching, or if it simply doesn't exist.
- Sometimes it's unclear whether the found data is up-to-date (or outdated) or whether its content is appropriate (e.g., not work-in-progress data).
Moreover, this kind of demanding work isn't a one-time task. If you want to analyze the data from a new perspective, you may have to start over from preparing the data.
Furthermore, the collected data is not always up-to-date. Every time new data is generated within the company, it is necessary to collect and input that data. Also, since data is generated and updated daily, it is necessary to keep the data already collected appropriately up-to-date, taking this into account.
"ETL" is a means to solve "thorny problems" in data utilization
While it's true that data collection is necessary, some might wonder if it's really worth investing in specialized tools. However, unfortunately, the reality is that a significant amount of time is spent collecting data and preparing it for analysis (it's said to account for 80% or even 90% or more of the overall effort required for data utilization), to the point where it becomes difficult to distinguish between data collection and analysis.
It is inherently true that preparing data takes more time than analyzing it. So, it can't be helped. However, even so, if possible, you should try to reduce the amount of work time you can and use it for analysis work instead of preparation.
This is why specialized tools were developed to efficiently retrieve data from a wide variety of data sources and perform the necessary data conversion processes. ETL tools make the process of "collecting and processing data," which is actually necessary before actually using the data, very efficient.
The task of "collecting and processing data" that most people have experienced
I think it's quite common to encounter situations where you need to "create a monthly report."
I think everyone has done the tedious task of extracting and transcribing data from various sources and pasting it into Excel for aggregation. During that process, you might have had to do some preliminary work to standardize the data format (converting full-width and half-width characters, or fixing inconsistent data formats). Then, you have to paste the analysis results into a presentation document to finally create a report—this kind of time-consuming work is quite common.
I had never questioned the process of monthly data collection, but when I think about it, it's not a very productive task. All I do is collect data, convert it, and paste it, and I'm not spending time on the actual work of analyzing and thinking, which is not desirable. ETL and other "connecting" technologies can reduce the amount of work that was previously thought of as "natural work."
ETL is exactly what we need now: As a means to realize "cloud utilization" and "generative AI utilization"
The importance of developing "connecting" tools such as ETL is not limited to situations where data analysis infrastructure is being built, as described above.
In various aspects of "cloud utilization," as well as in the "utilization of generative AI," which has been a hot topic recently, data integration is often a crucial factor.
As a means to successfully utilize the cloud and multiply the results of implementation
Let's say you want to introduce and utilize a new cloud service. Many benefits can be expected from cloud adoption. You can avoid the cost and time spent developing your own IT systems, and implementation can be quick and low-cost. While this is true if you're only considering implementation, it's not the end goal. You must utilize it to achieve results.
Even after implementing a cloud service, it won't contain any data. To utilize it effectively, you need to prepare and input the necessary data. This necessary data is likely scattered throughout the company in various formats. Just like with data analysis, you need to gather the necessary data, connect it to the cloud, and enable the cloud service to function effectively.
Even after successful implementation, data problems can still occur. For example, suppose you start using an email send service and receive a request from within the company to send emails to people who attended a seminar. The participant list is stored on a different cloud service used for seminar registration, and the data format is different. What's more, the seminar is held every week. Without a way to automatically data integration, you would have to go through the trouble of inputting and outputting data every week.
Moreover, these problems tend to occur more the more the cloud is used after it has been introduced, and problems continue to arise even if another cloud service is introduced after the introduction of the cloud (for example, introducing Salesforce after introducing kintone). If the more you use the cloud, the more manual work that hinders its use increases, and you will not be able to fully utilize the potential of the cloud.
As a means of integrating "legacy IT" and "latest IT"
One of the problems that often arises when adopting cloud computing is what to do with the "IT that was used before."Typically, this is the issue of what to do with business systems such as old mainframes, or business processes that have been handled using Excel.
While some companies may adopt less cautious approaches, such as attempting to abolish old IT systems all at once when migrating to the cloud, in reality, replacing legacy IT is not easy.
In reality, this often results in endless manual data transfers between legacy IT and the newly implemented cloud. This is not a desirable situation. In many cases, it is not realistic to completely eliminate legacy IT, so the real solution to the problem is to find a way to automatically share data.
An excellent means of achieving "business automation" and "business efficiency"
Many companies try to automate business processes as part of their efforts to promote IT utilization. However, many companies may find that, for example, while they attempt to automate processes using RPA, they don't achieve the desired results. For instance, it might seem to work well at first, but then quickly become unstable.
The essence of business process automation often lies in data integration, such as data input, output, and processing. Furthermore, many data integration tool can not only read and write data, but also call functions from the target system.
By utilizing data integration tool, you can achieve good results in business automation, as they operate stably and can process large amounts of data quickly.
As a means to realistically succeed in "utilizing generative AI"
The principle that "it cannot be fully utilized without appropriate data" also applies to the use of generative AI, which has been a hot topic recently.
Generative AI, which can be used as if conversing with a human and is capable of advanced tasks, is expected to have business applications. However, generative AI only learns general knowledge and does not possess the "knowledge about one's own business" that is naturally necessary to produce results.
In that case, "providing the necessary knowledge and data in some way," such as through RAG, becomes necessary to achieve results using generative AI. In other words, the same "data is needed" problem arises when using generative AI, so it becomes necessary to develop a data infrastructure and create an environment where data integration tool can be effectively utilized.
⇒ Retrieval Augmented Generation (RAG) | Glossary
"Connecting" technology that enables efficient and effective data utilization
Now that we've seen how data integration can resolve various problems and how it can bring significant benefits to both data utilization and new IT applications like cloud computing, the next questions that arise are likely "How can we implement this?" and "Can our company actually use it effectively?"
ETL, or automated data integration itself, can be achieved through various means. It can be built using regular programming, or it can be done simply by using a basic tool to integrate the data. However, a full-fledged programming approach is often considered too time-consuming and costly, while tools have limitations, leading to the feeling that there isn't a good solution.
There is a way to efficiently develop applications that meet these data integration needs using "GUI alone.""EAI," "ETL," and "iPaaS "known as '," DataSpider" or "HULFT Square "These are 'connecting' technologies, such as '...'. These By utilizing this feature, you can ensure that automated data synchronization runs smoothly and efficiently.
The advantage of being able to use and develop using only a GUI.
Unlike regular programming, there is no need to write code. By placing and configuring icons on the GUI, you can achieve integration with a wide variety of systems, data, and cloud services.
No-code development using only a GUI may seem like a simple compromise compared to full-scale programming. However, if development can be done using only a GUI, it becomes possible for on-site personnel to proactively work on cloud integration themselves.
The people who understand the business best are the people on the ground. The ability for these people themselves to proactively implement necessary data utilization, cloud computing, and business process automation is superior to a situation where they have to explain and ask engineers for help every time something needs to be done.
Full-scale processing can be implemented
Many products advertise that development can be done solely with a GUI, but some people may have a negative impression of such products, thinking they can only do basic things.
It is true that things like "it's easy to make, but it can only do simple things," "when I tried to execute a full-scale process it couldn't process and crashed," or "it didn't have the high reliability or stable operating capacity to support business operations, which caused problems" tend to occur.
"DataSpider" and "HULFT Square" are easy to use, but they also allow for the creation of processing at a level comparable to full-fledged programming. They have high processing power similar to full-fledged programming, such as being internally converted to Java and executed, and have a proven track record of supporting corporate IT for many years. They combine the advantages of a "GUI-only" interface with the proven track record and full capabilities of professional use.
What is necessary for a "data infrastructure" to successfully utilize data?
The ability to connect to a wide variety of data sources is certainly necessary, and high processing power is required because large amounts of data will often need to be processed. On the other hand, trial and error is often crucial in data utilization, so it is also necessary to be able to flexibly and quickly create or rebuild data integration under the leadership of the field staff.
Generally, demanding high performance and advanced processing capabilities often results in tools that are difficult to program or use. However, prioritizing ease of use in a real-world setting often leads to tools that are easy to use but have low processing power and can only perform simple tasks. This is a dilemma, or perhaps it's perceived as a trade-off where one must compromise on one aspect.
In addition, they must have advanced access capabilities to a wide variety of data sources, especially legacy IT systems such as mainframes and non-modern data sources such as on-site Excel, as well as the ability to access the latest IT systems such as the cloud.
There are many methods that meet just one of these conditions, but to successfully utilize data, all of them must be met. However, there are not many methods for achieving data integration that are both usable in the field and have the high performance and reliability of a professional tool.
It can be operated on-premises and can also be used as an i PaaS that does not require on-premises management.
With DataSpider, you can reliably operate it within your own managed systems. With HULFT Square, a cloud service (iPaaS), you can use this kind of "connecting" technology itself as a cloud service, eliminating the hassle of in-house implementation and system operation.
Related keywords (for further understanding)
- BI tools
- This tool allows you to aggregate and analyze data using various analytical axes. It's a means of analyzing data and obtaining analysis results, and it has features that present the analysis results in an easy-to-understand format, such as graphs, in reports.
- DWH
- A database for storing data to be analyzed. It has specialized performance for analysis, and is often suited to storing large amounts of data and executing analytical processing.
- EAI
- This approach involves "connecting" systems through data integration, providing a means to freely link various data and systems. It's a concept that has been active long before the cloud era as a way to effectively promote the use of IT.
- ETL
- In the recent trend of actively working on data utilization, the majority of the work is not the data analysis itself, but rather the collection and preprocessing of data scattered around, from on-premise to cloud. This is a means to carry out such processing efficiently.
- iPaaS
- iPaaS refers to a cloud service that "connects" various clouds with external systems and data simply through a graphical user interface (GUI).
- Cloud integration
- Using the cloud in conjunction with external systems and other cloud services. In order to successfully introduce and utilize cloud services, achieving cloud integration is often as important as introducing and utilizing the cloud itself.
- Excel Link
- Excel is an essential tool in the use of IT in the real world. By effectively linking Excel with external IT, you can make the most of Excel's strengths while smoothly promoting IT use.
DataSpider evaluation version and free hands-on seminar
"DataSpider," data integration tool developed and sold by our company, also has ETL functions and is data integration tool with a proven track record.
It allows development using only a GUI (no-code) without writing code like in conventional programming, and boasts "high development productivity," "full-fledged performance capable of handling the foundation of business operations (professional use)," and "ease of use that can be used by people in the field themselves (even non-programmers can use it)." It can smoothly solve the problem of "connecting fragmented systems and data," which hinders the success of various IT utilizations, including not only data utilization but also cloud utilization.
We offer a free trial version and hands-on seminars where you can try it out for free, so we hope you'll give it a try.
Glossary Column List
Alphanumeric characters and symbols
- The Cliff of 2025
- 5G
- AI
- API [Detailed version]
- API Infrastructure and API Management [Detailed Version]
- BCP
- BI
- BPR
- CCPA (California Consumer Privacy Act) [Detailed Version]
- Chain-of-Thought Prompting [Detailed Version]
- ChatGPT (Chat Generative Pre-trained Transformer) [Detailed version]
- CRM
- CX
- D2C
- DBaaS
- DevOps
- DWH [Detailed version]
- DX certified
- DX stocks
- DX Report
- EAI [Detailed version]
- EDI
- EDINET [Detailed version]
- ERP
- ETL (Extract/Transform/Load) [Detailed version]
- Excel Linkage [Detailed version]
- Few-shot prompting / Few-shot learning [detailed version]
- FIPS140 [Detailed version]
- FTP
- GDPR (EU General Data Protection Regulation) [Detailed version]
- Generated Knowledge Prompting (Detailed Version)
- GIGA School Initiative
- GUI
- IaaS [Detailed version]
- IoT
- iPaaS [Detailed version]
- MaaS
- MDM
- MFT (Managed File Transfer) [Detailed version]
- MJ+ (standard administrative characters) [Detailed version]
- NFT
- NoSQL [Detailed version]
- OCR
- PaaS [Detailed version]
- PCI DSS [Detailed version]
- PoC
- REST API (Representational State Transfer API) [Detailed version]
- RFID
- RPA
- SaaS (Software as a Service) [Detailed version]
- SaaS Integration [Detailed Version]
- SDGs
- Self-translate prompting / "Think in English, then answer in Japanese" [Detailed version]
- SFA
- SOC (System and Organization Controls) [Detailed version]
- Society 5.0
- STEM Education
- The Flipped Interaction Pattern (Please ask if you have any questions) [Detailed version]
- UI
- UX
- VUCA
- Web3
- XaaS (SaaS, PaaS, IaaS, etc.) [Detailed version]
- XML
- ZStandard (lossless data compression algorithm) [detailed version]
A row
- Avatar
- Crypto assets
- Algorithms / Computational Complexity Theory / P / NP [Detailed Version]
- Ethereum
- Elastic (elasticity/stretchability) [detailed version]
- Autoscale
- Open data (detailed version)
- On-premise [Detailed version]
Ka row
- Carbon Neutral
- Virtualization
- Government Cloud [Detailed Version]
- availability
- completeness
- Machine Learning [Detailed Version]
- mission-critical system, core system
- confidentiality
- Cashless payment
- Symmetric key cryptography / DES / AES (Advanced Encryption Standard) [Detailed version]
- Business automation
- Cloud
- Cloud Migration
- Cloud Native [Detailed version]
- Cloud First
- Cloud Collaboration [Detailed Version]
- Retrieval Augmented Generation (RAG) [Detailed version]
- Public-key cryptography / Digital signatures / One-way functions [Detailed version]
- In-Context Learning (ICL) [Detailed version]
- Container [Detailed version]
- Container Orchestration [Detailed Version]
Sa row
- Serverless (FaaS) [Detailed version]
- Siloization [Detailed version]
- Subscription
- Supply Chain Management
- Singularity
- Single Sign-On (SSO) [Detailed version]
- Scalable (scale up/scale down) [Detailed version]
- Scale out
- Scale in
- Smart City
- Smart Factory
- Small start (detailed version)
- Generative AI (Detailed version)
- Self-service BI (IT self-service) [Detailed version]
- Loose coupling [detailed version]
Ta row
- Large Language Model (LLM) [Detailed version]
- Post-Quantum Cryptography (PQC) / Quantum Computers / Cryptogility / Harvest Attacks [Detailed Version]
- Deep Learning
- Data Migration
- Data Catalog
- Data Utilization
- Data Governance
- Data Management
- Data Scientist
- Data-driven
- Data analysis
- Database
- Data Mart
- Data Mining
- Data Modeling
- Data Lineage
- Data Lake [Detailed version]
- data integration / data integration platform [Detailed Version]
- Digitization
- Digitalization
- Digital Twin
- Digital Disruption
- Digital Transformation
- Deadlock [Detailed version]
- Telework
- Transfer learning (detailed version)
- Electronic Payment
- Electronic Signature [Detailed Version]
Na row
Ha row
- Harvest Attack (HNDL: Harvest Now, Decrypt Later) [Detailed Version]
- Hybrid Cloud
- Batch Processing
- Unstructured Data
- Big Data
- file transfer [Detailed Version]
- Fine Tuning [Detailed Version]
- Private Cloud
- Blockchain
- Prompt template [detailed version]
- Vectorization/Embedding [Detailed version]
- Vector database (detailed version)
Ma row
- Marketplace
- migration
- Microservices (Detailed Version)
- Managed Services [Detailed Version]
- Multi-tenant
- Middleware
- Metadata
- Metaverse
Ya row
Ra row
- Leapfrogging (detailed version)
- Quantum cryptography / Quantum key distribution (QKD) / Quantum key distribution protocol BB84 [Detailed version]
- quantum computer
- Route Optimization Solution
- Legacy System/Legacy Integration [Detailed Version]
- Low-code development (detailed version)
- Role-Play Prompting [Detailed Version]
Wa row
Recommended Content

Recommended Articles
-

How can we turn the "tacit knowledge" lying dormant within our company into "AI knowledge" and utilize it?
We will explain the specific process for turning unstructured data scattered throughout your company into an asset and maximizing the potential of AI. -
Automated classification of product masters using generative AI: How to bring a new perspective to your analysis
We will explain the new perspectives that transformation in product master management brings, through the mechanism of automatic classification brought about by generative AI and the benefits that can be gained by adopting it. -
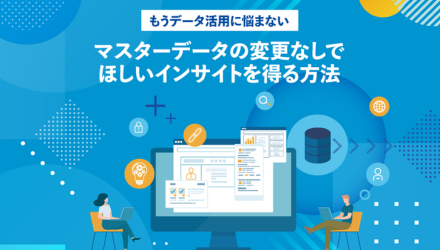
How to get the insights you want without changing your master data
This e-book offers a new approach to solutions for companies that have data but are not making use of it.